


Green bonds have become firmly entrenched in the global debt market. Although green bonds are still dwarfed by the overall fixed income market, the asset class has now exceeded $1.5 trillion of cumulative issuance according to the Climate Bonds Initiative, and corporate and sovereign entities alike are now issuing green bonds.
Green bonds fund projects with clear environmental benefits and, in particular, projects that avoid carbon emissions compared with a conventional approach. Renewable energy, green transport and green buildings make up the bulk of green bond-financed projects.
At S&P Global Sustainable1, we believe that quantifying these environmental benefits will contribute to developing a green bond market that is robust, credible and transparent. Investors need to be able to quantify and monitor the impact of their green bond investments in their overall net zero investment strategy and report on that positive impact in a consistent manner.
The Trucost Green Bond dataset provides granular data on the use of proceeds of green bonds by technology (including technologies listed in the EU taxonomy) and region, as well as both the absolute and avoided carbon emissions generated by the projects. S&P Global Sustainable1 collects and analyzes public disclosures from issuers and uses lifecycle analysis to estimate absolute and avoided carbon emissions. These estimates take into account each project’s disclosed features (e.g., megawatts of electricity produced, location, year of construction) and the entire lifecycle of the project across construction, operational, and decommissioning phases. Investors can then cross-check the avoided carbon emissions disclosed by the issuer with our estimates. This is particularly helpful if, for example, an issuer has not taken into account the emissions from the construction phase or has not used a country-specific baseline for renewable energy projects.
Our data shows that the volume of avoided emissions per $1 million invested varies between green bonds, depending on the type of project, its location and other factors. Some projects will have little positive impact, not because the project itself is not green but rather because the additionality (i.e. how this project’s carbon intensity compares with the baseline’s carbon intensity) is minimal.
Green bond-financed renewables in Africa have the greatest impact on emissions
Average avoided emissions intensity for green bonds financing renewable electricity and heat production projects, tCO2e per $1M invested
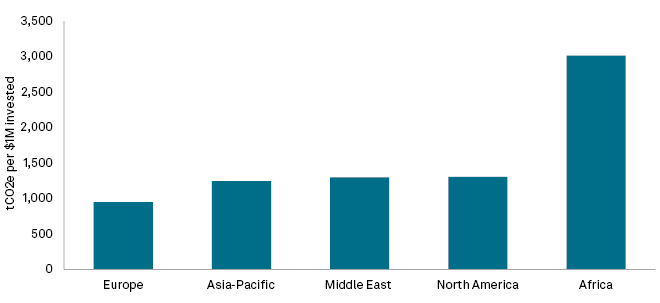
Data as of Sept. 12, 2022.
tCO2e = tonnes of carbon dioxide-equivalent
Source: 2022 Trucost Green Bond Dataset, S&P Global Sustainable1
Additionality is minimal in particular for green building projects, for example, because a building’s absolute carbon footprint is much lower on average than a power plant or a subway. Projects to install renewable electricity generation and heat production have the greatest impact on avoided emissions at more than 1,000 tonnes of CO2-equivalent per $1 million invested on average, while green transport projects avoid more than 600 tonnes of CO2-equivalent per $1 million invested on average.
The second major factor that explains the differences in avoided emissions among green bonds is location. European renewables-focused green bonds, for example, tend to generate less avoided emissions per $1 million invested than renewables-focused bonds in other regions, and in particular Africa. This can be explained by the relatively low carbon intensity of the existing electricity mix in Europe, which is used as the baseline in the avoided emissions calculation, and the high carbon intensity of the current electricity mix in Africa.
Green bonds to finance building projects have less impact on avoided emissions
Global average of avoided emissions intensity for green bond project activities, tCO2e per $1M invested
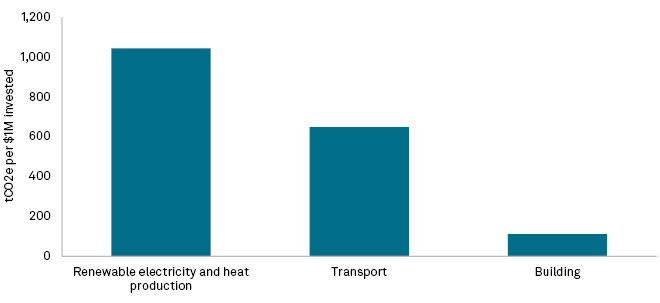
Data as of Sept. 12, 2022.
tCO2e = tonnes of carbon dioxide-equivalent
Source: 2022 Trucost Green Bond Dataset, S&P Global Sustainable1
This data can help investors optimize the decarbonization yield of their green bond strategies.
In line with the recommendations from the Partnership for Carbon Accounting Financials, we also calculate the absolute carbon emissions of a green bond: the actual direct and indirect emissions of the financed project. These emissions relate to the construction, operational phase and disposal of the projects financed by the bond. In corporate carbon accounting terminology, these emissions would fall under Scopes 1, 2 and 3. The calculation of absolute emissions will allow investors to compare green and non-green bonds (using Trucost Environmental dataset for corporates, banks and agencies and Trucost Sovereign dataset for sovereign entities) on a like-to-like basis and, potentially, to aggregate absolute impact at the fixed-income portfolio level.
The Trucost Green Bond Dataset also monitors a green bond’s use of proceeds and carbon impact throughout the duration of the bond, allowing investors to check whether the positive impact generated by the green bond is in line with what was projected at issuance. The dataset also includes scores that can help fund managers during the green bond selection process.
The road to net zero is still long. The Intergovernmental Panel on Climate Change has estimated that limiting global warming to 1.5 degrees C relative to preindustrial levels by 2050 will require $3.5 trillion annually in investment. Green bonds will be a powerful tool in that transition, and the supply of high quality, comparable and transparent data will support that journey.