
The report reviews the events that were emblematic of the changes in trade policy, logistics sector and industrial supply chain operations in 2019, based on our monthly most-read research review and the more-than 1,300 reports published by Panjiva research in 2019. For each report we outline what it covered, why it mattered and what the data told us.
January – Newark’s new problem is congestion, clearance may just be a matter of time
The event: Congestion built up at many U.S. ports in late 2018 and early 2019 as a result of accelerated shipments to beat tariffs.
Why it mattered: Handling fees were increased and shipments delayed with recovery back to normal taking until later in 1Q, illustrating the fragility of supply chains to even modest disruptions.
What the data showed: There was a 12.8% year over year surge in traffic through the port of Newark/New York in 2018, though the top five freight operators’ market share has been squeezed.
CH ROBINSON AND ORIENT EXPRESS GET AGGRESSIVE IN NEW YORK
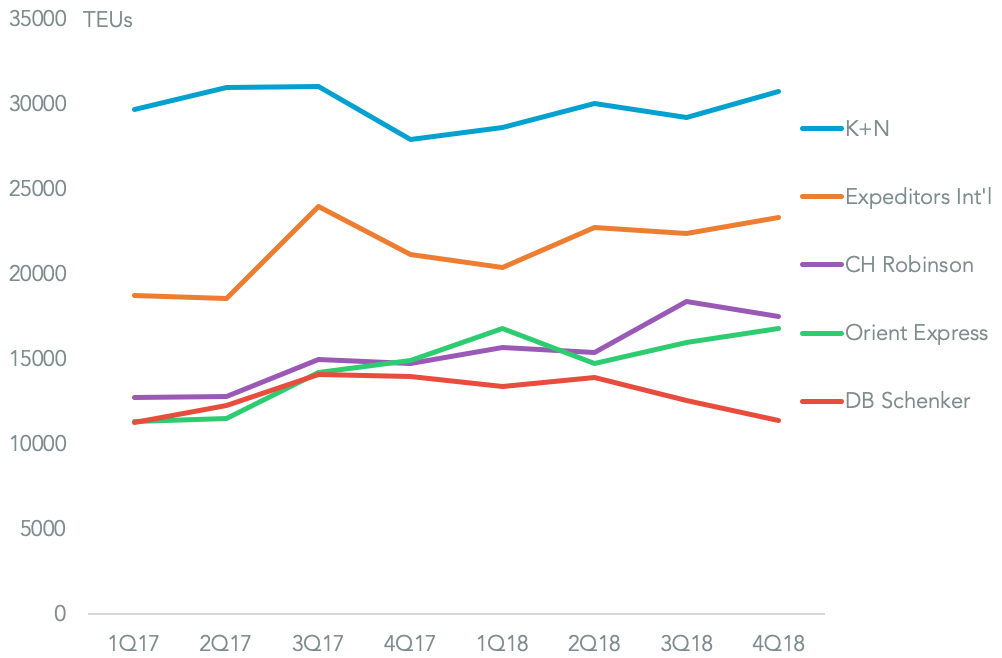
Chart segments seaborne imports to ports in New York and New Jersey by freight forwarder. Source: Panjiva
February – Semis only a small segment of a solution
The event: The first of many near-misses in terms of a U.S.-China trade deal included a memorandum of understanding that could have seen China increase its purchases of U.S. products.
Why it mattered: China wanted to include semiconductors in the list, but the heart of the trade war relates to U.S. concerns about China’s technological developments. Needless to say the MoU didn’t evolve into a full deal and negotiations continued through the rest of the year.
What the data showed: The U.S. accounted for less than 10% of China’s semiconductor imports in 2018, while directing 100% of U.S. semiconductor exports to China would only cut the U.S. trade deficit by 8%.
MALAYSIA THE MAIN POTENTIAL LOSER FROM REDIRECTED EXPORTS
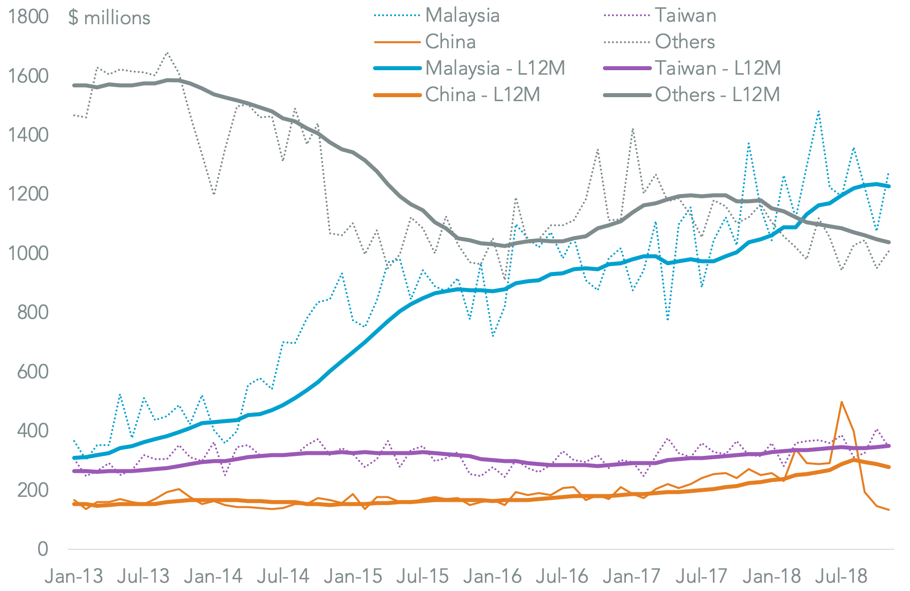
Chart segments U.S. exports of semiconductors by destination on a monthly and 12-month average basis. Source: Panjiva
March – Norsk Hydro Hack Might Cut Into Aluminum Supply Chains
The event: Aluminum producer Norsk Hydro suffered a ransomware attack.
Why it mattered: The logistics sector managed to avoid direct attacks after Maersk and FedEx’s travails in 2017 but Norsk Hydro’s situation showed supply chains are still vulnerable to cyber-security issues.
What the data showed: Importers working with Norsk Hydro that may face a disruption from reduced supplies including Eastman Kodak, Agfa and Southern Lithoplate.
NORSK HYDRO’S U.S. SOURCING HAS BECOME DIVERSIFIED IN 2018
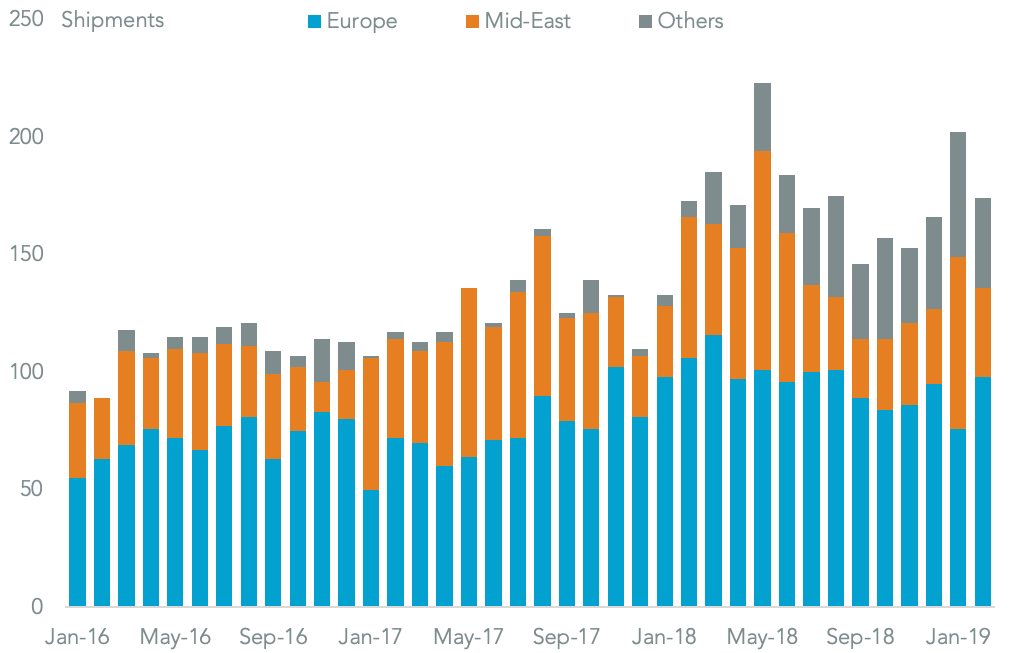
Chart segments U.S. seaborne imports of aluminum products associated with Norsk Hydro by origin. Source: Panjiva
April – Trump’s border threat raises the stakes for food
The event: President Trump threatened to close the border with Mexico as a response to continued migrant flows – he latterly also threatened to increase tariffs on all Mexican exports.
Why it mattered: It was just one example of the Trump administration’s use of trade policy in a wider geopolitical context – see more below on Turkey.
What the data showed: Truck-borne bilateral trade between the U.S. and Mexico – which would be disrupted by a closure – reached $484.4 billion in the 12 months to February 28, or 64.5% of all trade between the two countries, with the food sector particularly exposed.
LATE SEASON SUPPLY TROUBLES AHEAD IF BORDER IS CLOSED
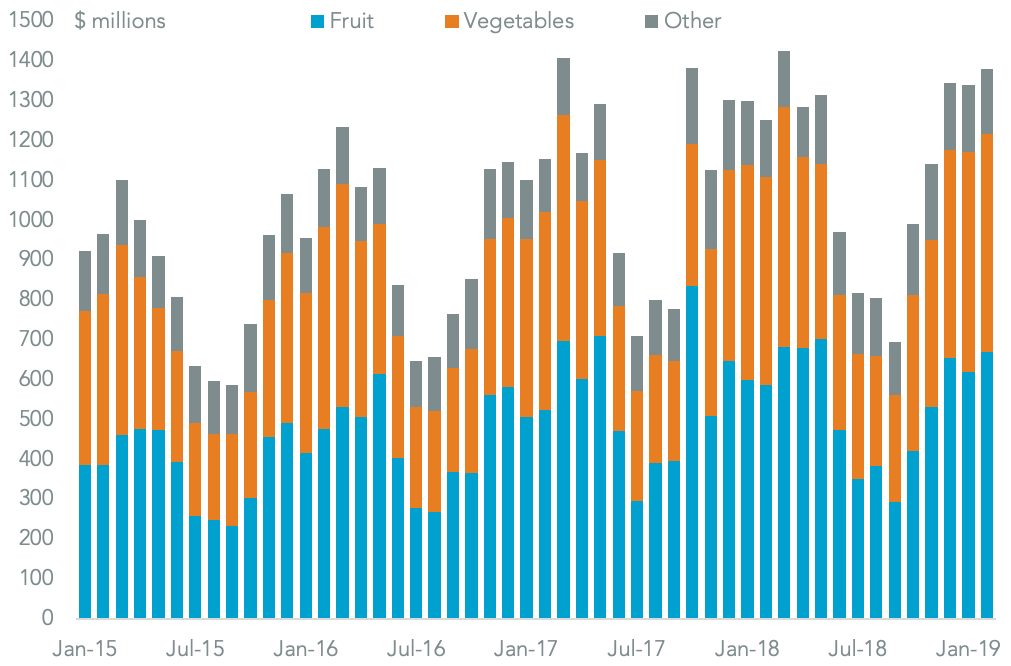
Chart segments Mexican agricultural exports to the U.S. by product, defined at HS-2 level. Source: Panjiva
May – Trump’s partly right on who pays for tariffs
The event: The U.S. government increased tariffs on “list 3” products imported from China to 25% from 10%.
Why it mattered: It was a major escalation in the trade war and forced corporations on both sides of the Pacific to further develop their supply chain strategies – Chinese exporters cut their prices for U.S. companies to share the burden.
What the data showed: The most marked price deflation on imports from China has been chemicals where prices fell 5.8% year over year in April.
PRICES DISSOLVE IN CHEMICALS, DEFLATION NOT NEW FOR TECH
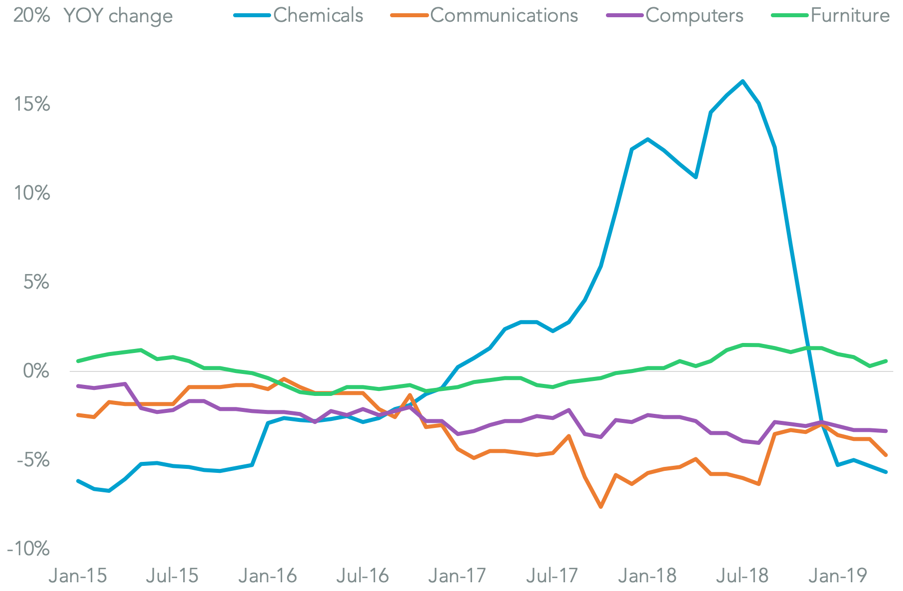
Chart segments U.S. import price inflation from China by industry. Calculations include Bureau of Labor Statistics figures. Source: Panjiva
June – Sumitomo, Yazaki Pull the Plug on China By Switching Supplies to Vietnam
The event: Vietnam’s government announced plans to aggressively pursue exporters that transship goods to the U.S. from China via Vietnam.
Why it mattered: The “winners” from the trade war – including Malaysia as well as Vietnam – are increasingly worried about being targeted for tariffs, potentially via a section 301 review.
Learn more about Supply Chain Intelligence
Click HereWhat the data showed: In the furniture sector 72.8% of the drop in seaborne shipments from China have been replaced by those from Vietnam.
EXPORTS OF CABLES CUT FROM CHINA
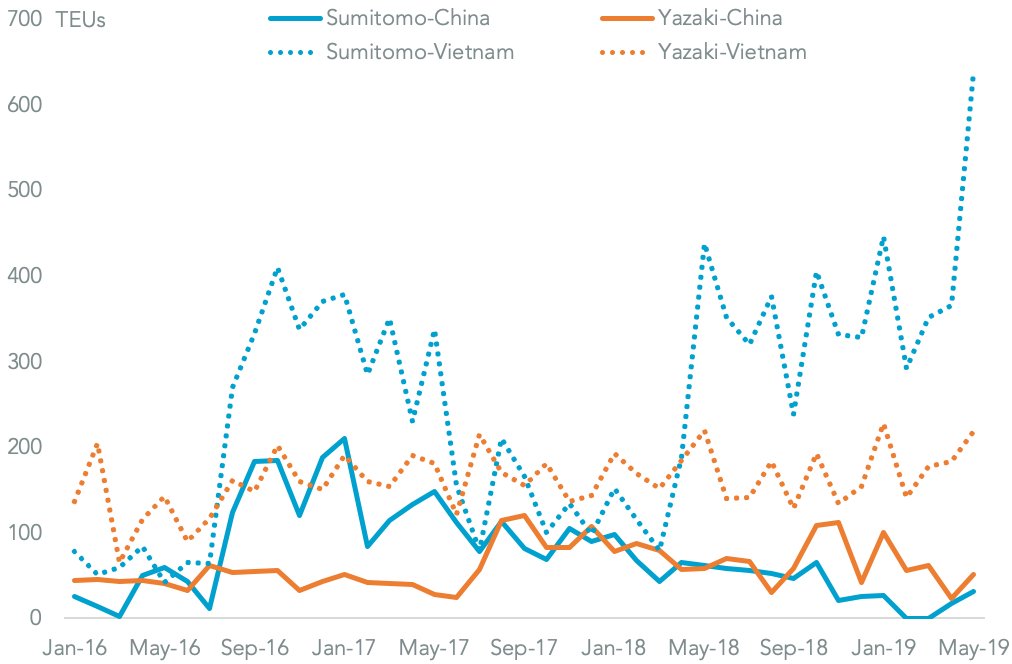
Chart segments U.S. seaborne imports of electric cables by shipper and origin for Sumitomo Electric and Yazaki. Source: Panjiva
July – Target, Best Buy Yet To Avoid China As Retail Sourcing Strategies Vary
The event: Over 600 retailers wrote to the Trump administration to protest against the application of “list 4” tariffs on exports from China from September.
Why it mattered: The Trump administration subsequently split the list into two groups (list 4A and 4B) with the latter list including seasonally-sensitive products, mitigating the impact on consumers during the holiday shopping season.
What the data showed: May retailers hadn’t yet cut their imports from China, with Target cutting its imports by just 0.7% year over year in 1H 2019 while Walmart increased it by 12.4%.
CHINA IMPORTS YET TO BE CUT, VIETNAM ATTITUDES DIFFER
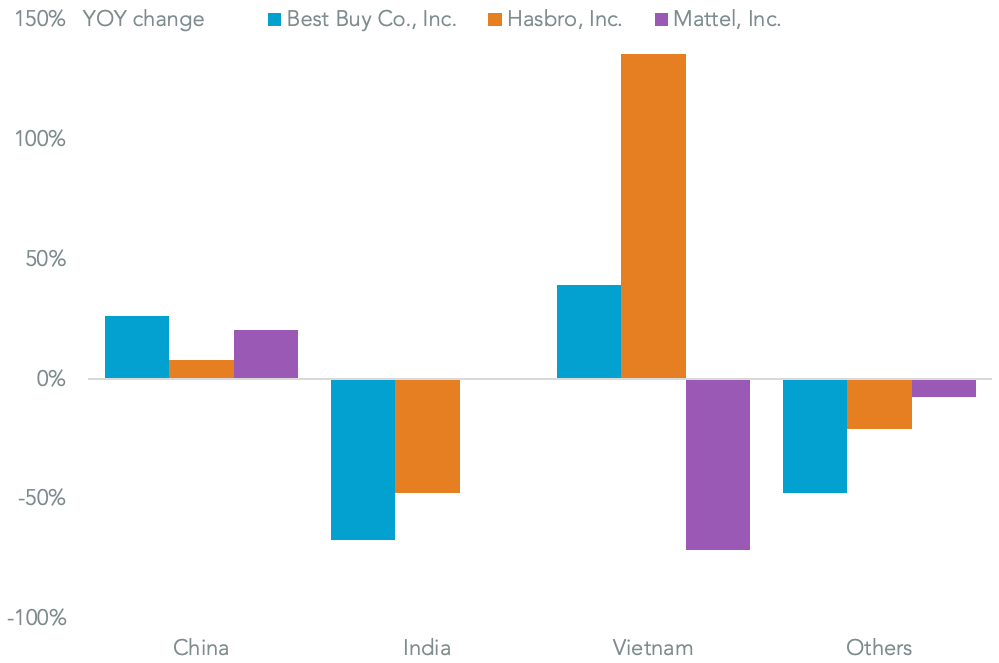
Chart segments year over year change by selected firms importing to the U.S. by volume in the first half of 2019. Source: Panjiva
August – Worse-Than-China Europe May Face Tariffs in Aerospace, Autos and Drugs Sectors
The event: President Trump characterized the EU as being “worse than China” in terms of applying “barriers, tariffs and taxes”.
Why it mattered: Trade talks between the EU and U.S. were stalled for most of the year, with a raising of negative rhetoric coming as the threat of section 232 automotive tariffs overhung the talks. Later in the year the Trump administration applied WTO-sanction tariffs on a wide-range of EU exports.
What the data showed: The U.S. merchandise trade deficit with the EU climbed 10.5% year over year in the 12 months to Jun. 30 to reach a record $175.5 billion. The largest contributors were jet engines where U.S. imports from the EU climbed 41.3% in the 12 months to June 30 on a year earlier.
DRUG IMPORTS FROM THE EU REACH A HIGH
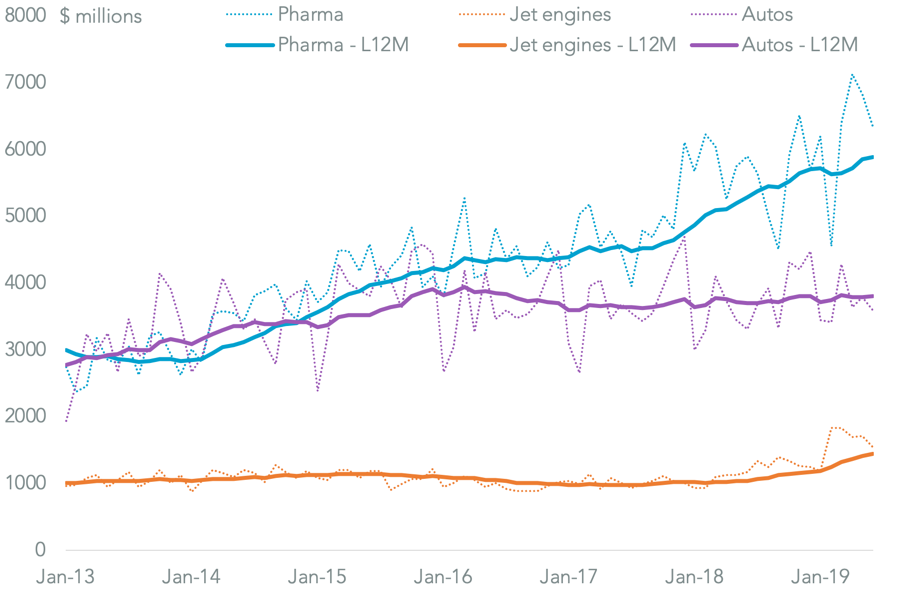
Chart compares U.S. imports of pharmaceuticals, cars and jet engines on a monthly and 12-month trailing average basis. Source: Panjiva
September – Saudi Oil Attack’s Direct Impact on U.S. May Be Limited
The event: A drone attack on Saudi Aramco’s oil facilities at Abqaiq and Khurais slashed oil production.
Why it mattered: The assumption had been that oil-related conflict in the Middle East would focus on the Straits of Hormuz – in any event global energy supply chains were disrupted.
What the data showed: U.S. seaborne imports associated with Motiva, Saudi Aramco’s U.S. refining division, consumed 6.7 million tons of imports in the 12 months to August 31, with other importers including Marathon and Phillips 66.
OUTSIDE ARAMCO MOST BUYERS ARE OCCASIONAL USERS OF SAUDI OIL
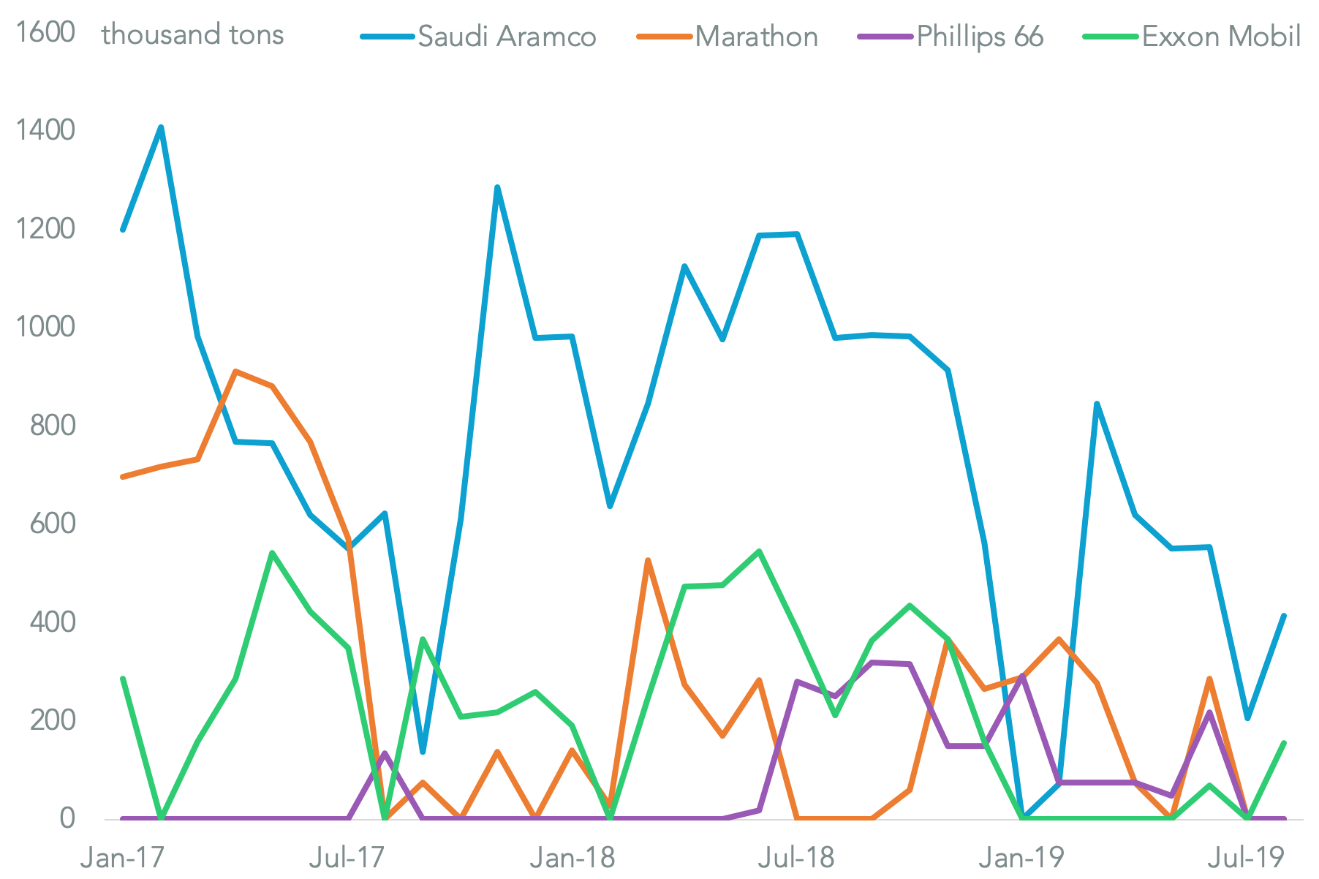
Chart compares U.S. seaborne imports by Saudi Aramco to other consignees importing from Saudi Arabia. Source: Panjiva
October – Trump’s Steel Stick Lacks Leverage With Erdogan, May Hurt Borusan
The event: The U.S. government increased section 232 duties on steel imports from Turkey to 50% from 25% in response to Turkish military action in Syria.
Why it mattered: It was another example of the Trump administration using trade policy for geopolitical ends. Notably though the U.S. courts ruled an earlier use of higher section 232 tariffs against Turkey a year earlier was not legitimate, curbing the administration’s ability to use the approach again.
What the data showed: Turkey represented just 1.5% of U.S. steel imports, while the U.S. represented just 6.3% of Turkey’s steel exports in 2018.
BORUSAN THE LARGEST SUPPLIER OF TURKISH STEEL, STILL MADE MAJOR CUTBACKS
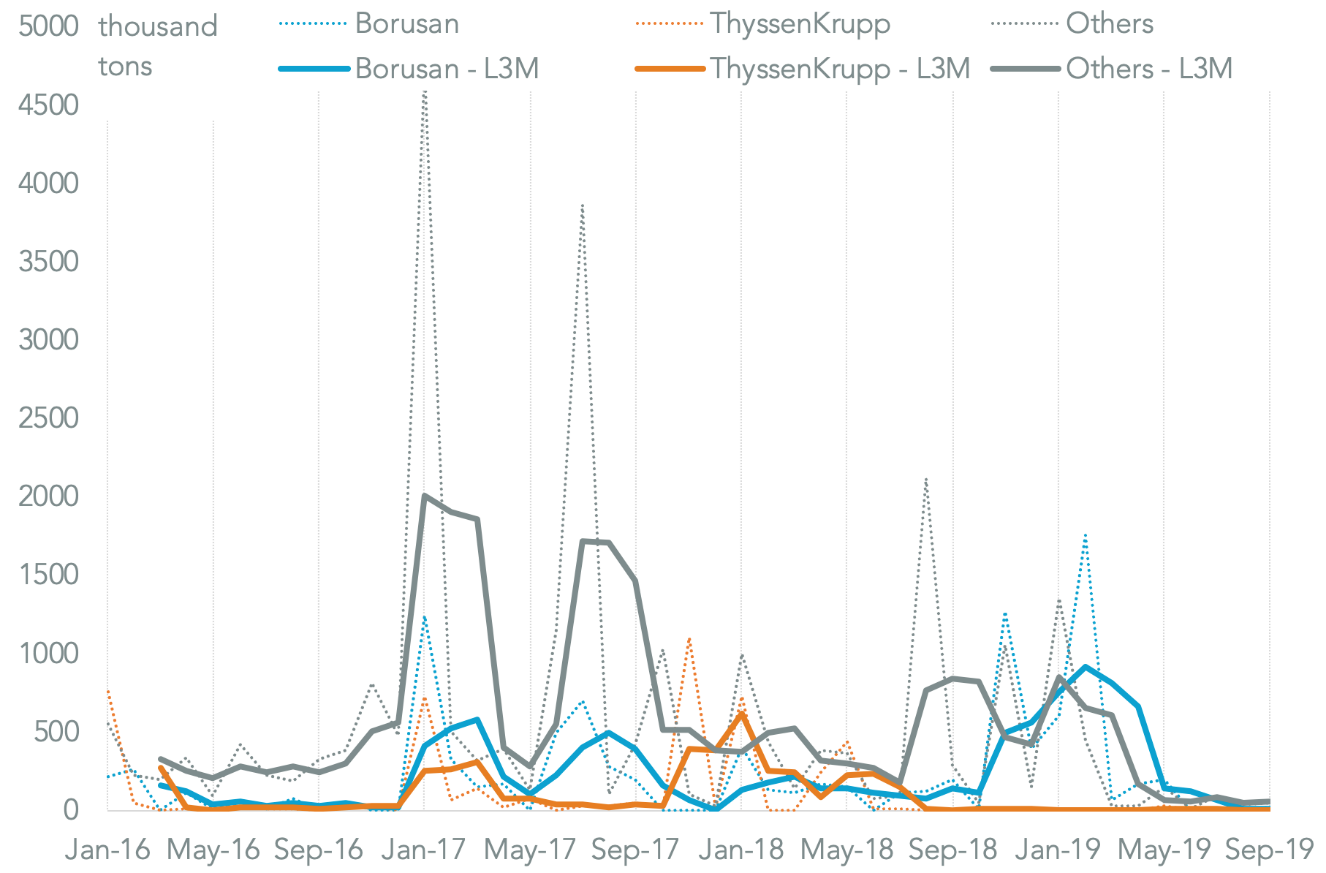
Chart segments U.S. seaborne imports of steel from Turkey on a monthly and three-month average basis including Borusan and ThyssenKrupp. Source: Panjiva
November – Modi Prioritizes Farmers, “Make in India” As RCEP Progresses Into 2020
The event: Talks to complete the Regional Comprehensive Economic Partnership (RCEP) trade deal will progress into 2020 without India.
Why it mattered: The move increases the likelihood that RCEP reaches a successful conclusion – India has continued to be committed to a tariff-led industrial development policy. It also decreases the likelihood of Indian trade liberalization in the context of U.S. trade talks in 2020.
What the data showed: India’s imports of agricultural products from the RCEP region reached $11.0 billion in the 12 months to Jul. 31 while its exports were just $8.1 billion.
INDIA’S AGRICULTURAL EXPORTS TO RCEP IN RETREAT AS IMPORTS STABILIZE
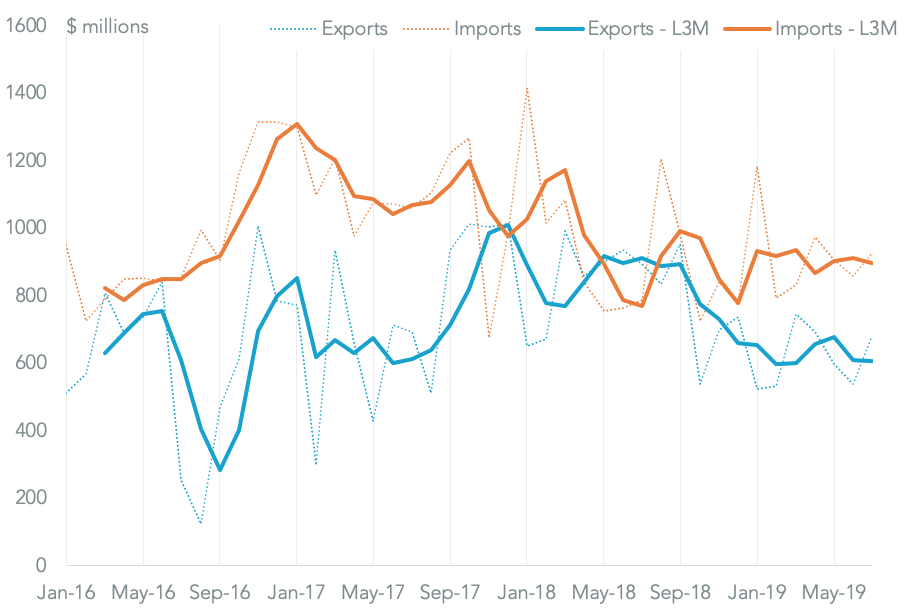
Chart compares Indian imports and exports of agricultural products with RCEP members on a monthly and three-month average basis. Source: Panjiva
December – Trade War Show Season 3 Finale – The Heroic Quest for $100 Billion
The event: The U.S. and China provisionally agreed a phase 1 trade deal that included Chinese commitments to policy change and significant purchase commitments while the U.S. rolled out part of September’s tariff increase.
Why it mattered: The deal still has to go through the translation and legal review processes, leaving room for a failure but nonetheless leading to a pause in trade war hostilities between the two countries and providing the Trump administration with a demonstrable win going into the election year.
What the data showed: The Chinese commitment to increase purchases from the U.S. by $200 billion in 2020 and 2021 versus 2017 involves some heroic assumptions can be done. Shipping 100% of U.S. crude oil, LNG and soybean exports, adding 50% to non-soybean agricultural sales, increased shipments of electronic components and boosting financial services sales could deliver $100 billion of extra exports annually.
ENERGY, SERVICES NEED TO LEAD THE WAY IN BOOSTING EXPORTS
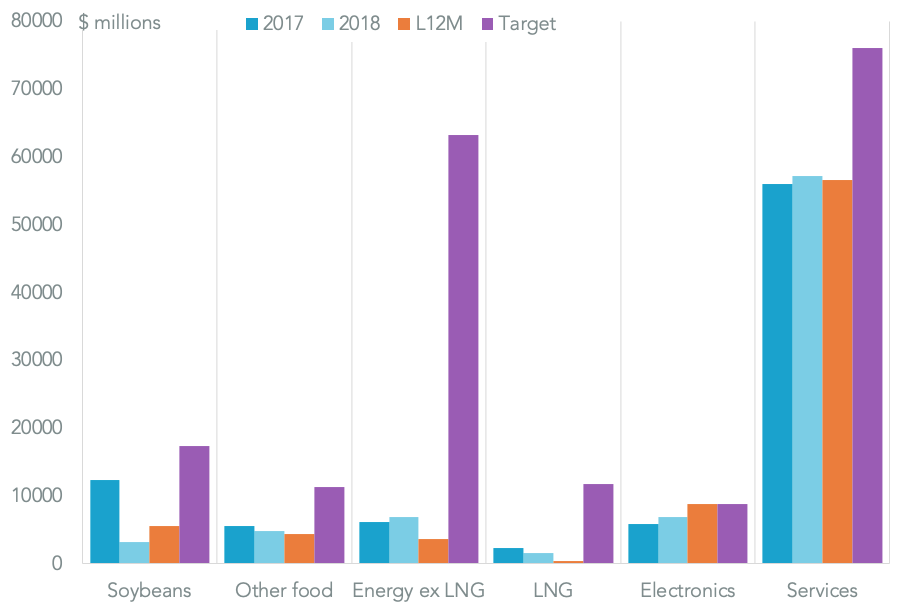
Chart compares U.S. exports to China by product. Target based on Panjiva assumptions regarding potential exports. Source: Panjiva