chartiq Market Intelligence /marketintelligence/en/solutions/chartiq content esgSubNav

Powerful, customized data visualization

ChartIQ is a data visualization tool and charting solution that brings any dataset to life with interactive graphic displays designed for the financial industry.

Retail brokerages and trading platforms use ChartIQ to elevate their users’ trading experience. Financial institutions and banks use ChartIQ to provide their end users with powerful data visualization tools that facilitate the discovery of critical information.

  • Easily integrate into any web or native applications to build an individualized user experience enhancing end-user workflow.
  • Access best-in-class support, tools, and documentation provided by the developers who create and maintain the product.
  • Use seamlessly across any platform—browser, desktop app, tablet, or mobile.
  • Incorporate data from any source, including proprietary content, such as trade history or research, alternative data sets, or analytics from third-party providers.

Request Follow Up

  • Technical Analysis
  • Trade Visualization
  • Active Trader
  • CrossPlot
  • Options Analytics
  • Term Structure Graph
  • S&P Global Dataset Integration

A complete technical analysis platform

ChartIQ Technical Analysis is a comprehensive charting platform that satisfies advanced technical analysts while preparing generalists for the next level. From retail day traders to institutional power analysts, ChartIQ Technical Analysis provides robust charts and tools for faster trade decisions.

Learn more about Technical Analysis

Visualize trade executions from start to finish

Analyze the lifespan of an event and see its impact on market activity. Visualize scenarios like the position holding period of any length, from minutes to months. Incorporate any dataset or reconstruct the life cycle of an order to meet the requirements of Dodd-Frank and MiFID II. Explore the power of data visualization tools to enhance your analysis.

Learn more about Trade Visualization

A comprehensive, holistic trading toolkit

Complement our time series charts with Active Trader & Trade from Chart, our  trading-specific toolkit. Seamlessly delivered on all platforms and devices, Active Trader & Trade from Chart is an off-the-shelf white labeled charting software solution that’s easy to assemble.

Learn more about Active Trader & Trade from Chart

Flexible and interactive graphic displays for financial data visualization

ChartIQ's CrossPlot is an interactive multidimensional graphic for comparing multiple instruments which are displayed as a curve or scatterplot at a given point in time. As a cross-sectional graphic it excels at highlighting outliers that require further analysis. CrossPlot provides the ability to display up to seven data dimensions simultaneously. CrossPlot is an excellent complement to our time series chart enabling linked graphic displays for efficient visual workflows and financial data visualization.

Learn more about CrossPlot

A powerful solution to simplify options analytics

Navigate the complicated landscape of options analytics and visualize your go-forward strategy with our innovative set of powerful analytical and data visualization tools. ChartIQ helps traders understand the options market and the liquidity of each instrument to make confident investment decisions.

Learn more about Options Analytics

Real-time, interactive charts for fixed income, currencies, and commodities.

Upgrade the workflows of FICC trading divisions with robust data visualization and interactive graphic displays.

  • Visualize data instantly

  • Monitor market activity in real time

  • Zoom and pan with interactive charts

  • Spot relationships between points on the curve

  • See recent updates with time-stamped data points

  • Compare curves over time and across entities

  • Drill down to a time series chart for multiple instruments

  • Understand spreads between points between curves or along a curve with interactive analysis tool

Learn more about Term Structure Graph

S&P Global Dataset Integration

Bring S&P Global data to life with ChartIQ's dynamic visualizations. ChartIQ now offers pre-configured interactive graphic displays for S&P Capital IQ Estimates, Key Developments, S&P Capital IQ Financials, and Transactions data. Clients can now quickly integrate data from S&P Global with other datasets including proprietary content and third-party data. Discover the capabilities of in-depth visual analysis across all four datasets, accessible on various platforms including browsers, desktop, tablets, and mobile devices. These datasets mark the initial phase of the S&P Global integration strategy. ChartIQ is dedicated to continually broadening its offerings to provide deeper insights and opportunities.

Explore a live demo

View the infographic

Differentiate your offering. Grow your user base.

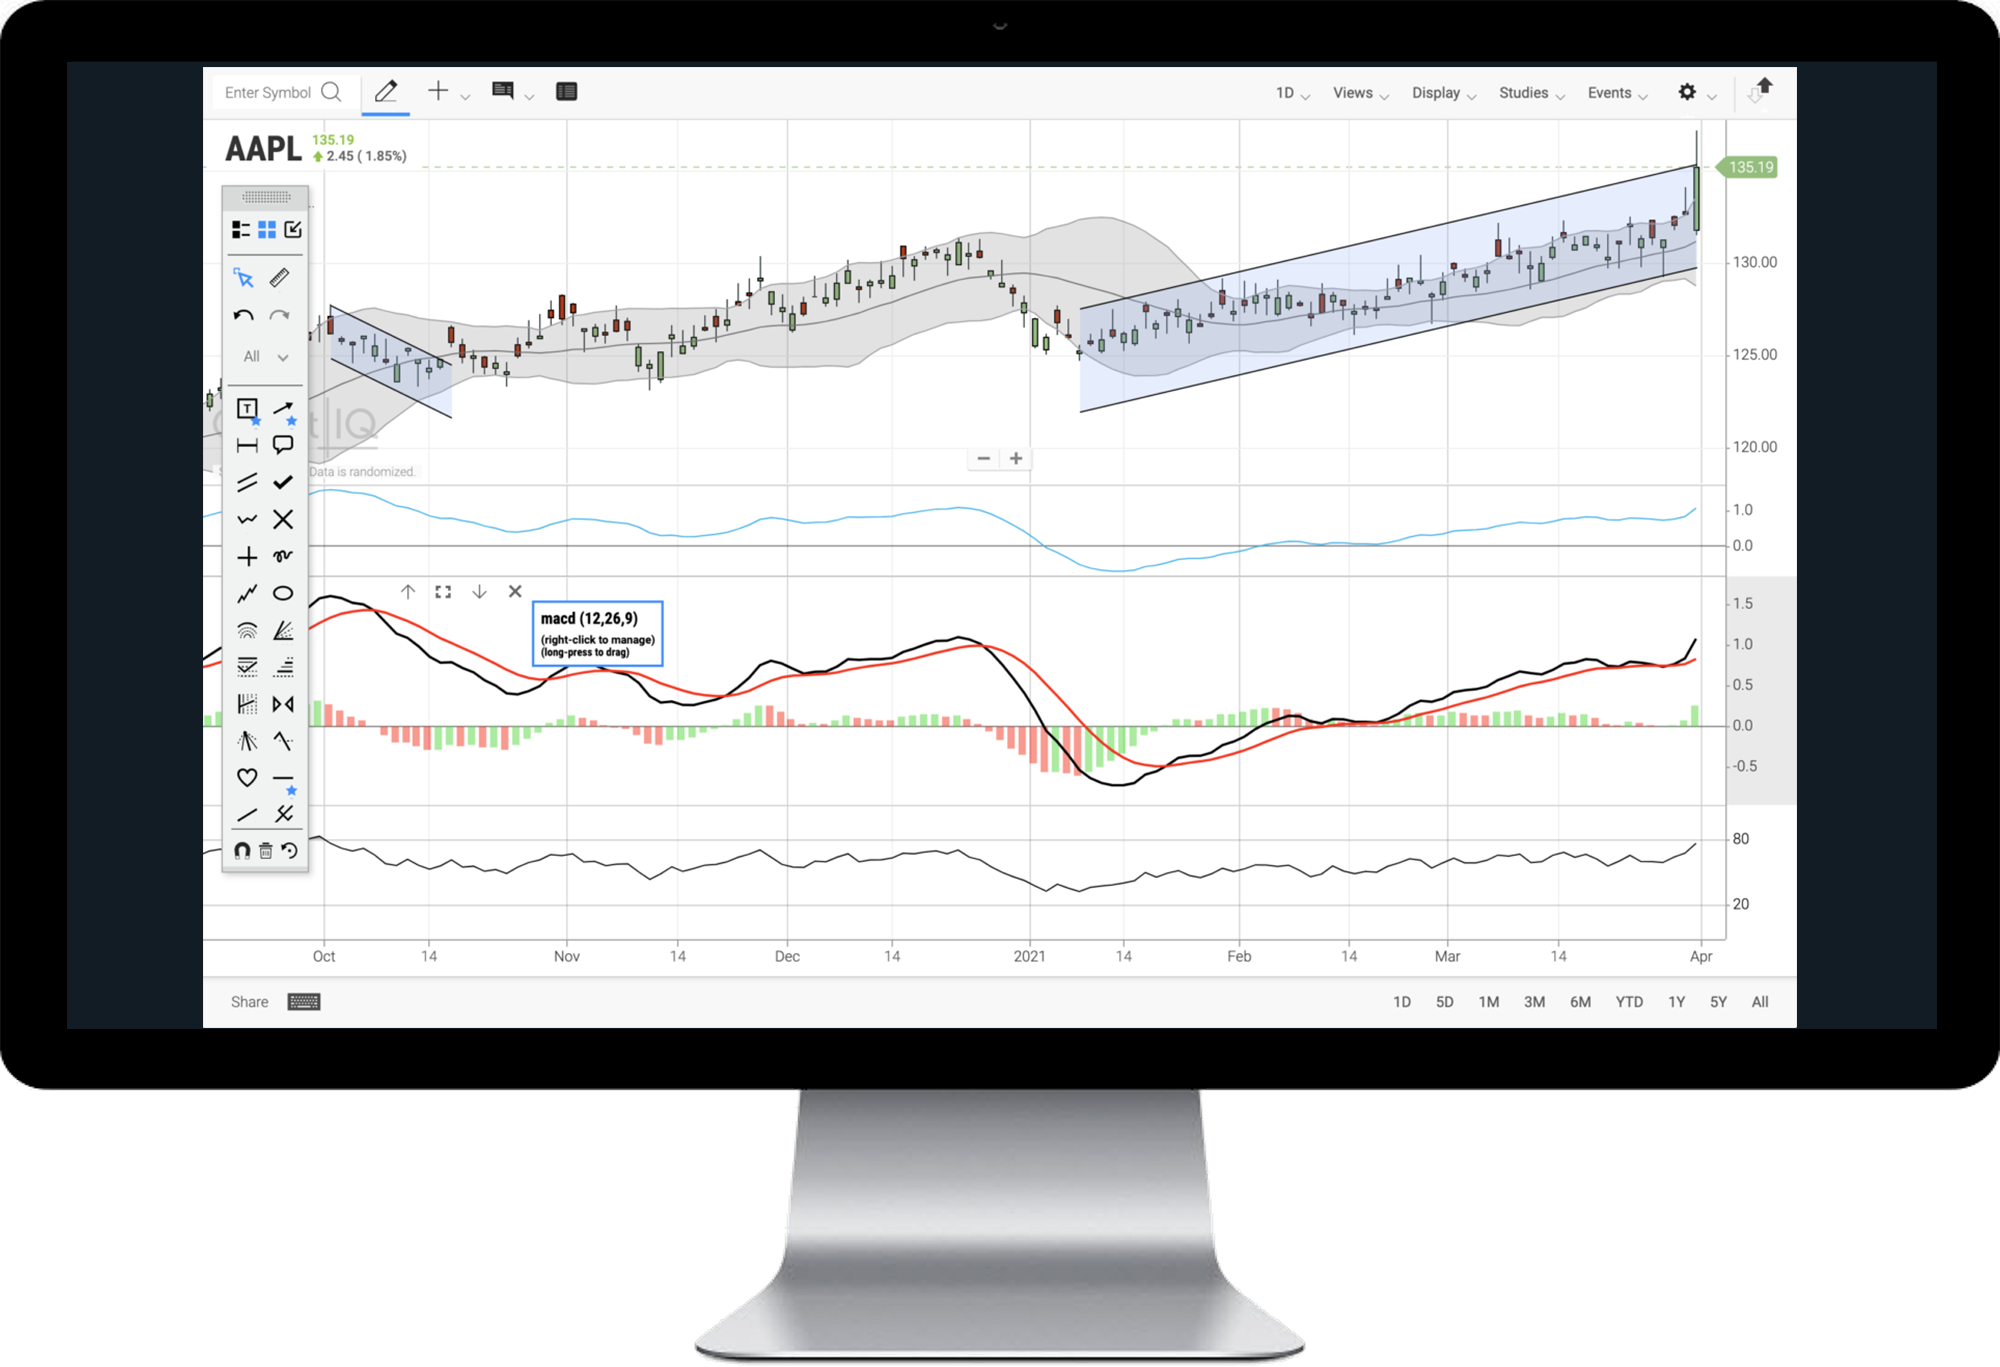
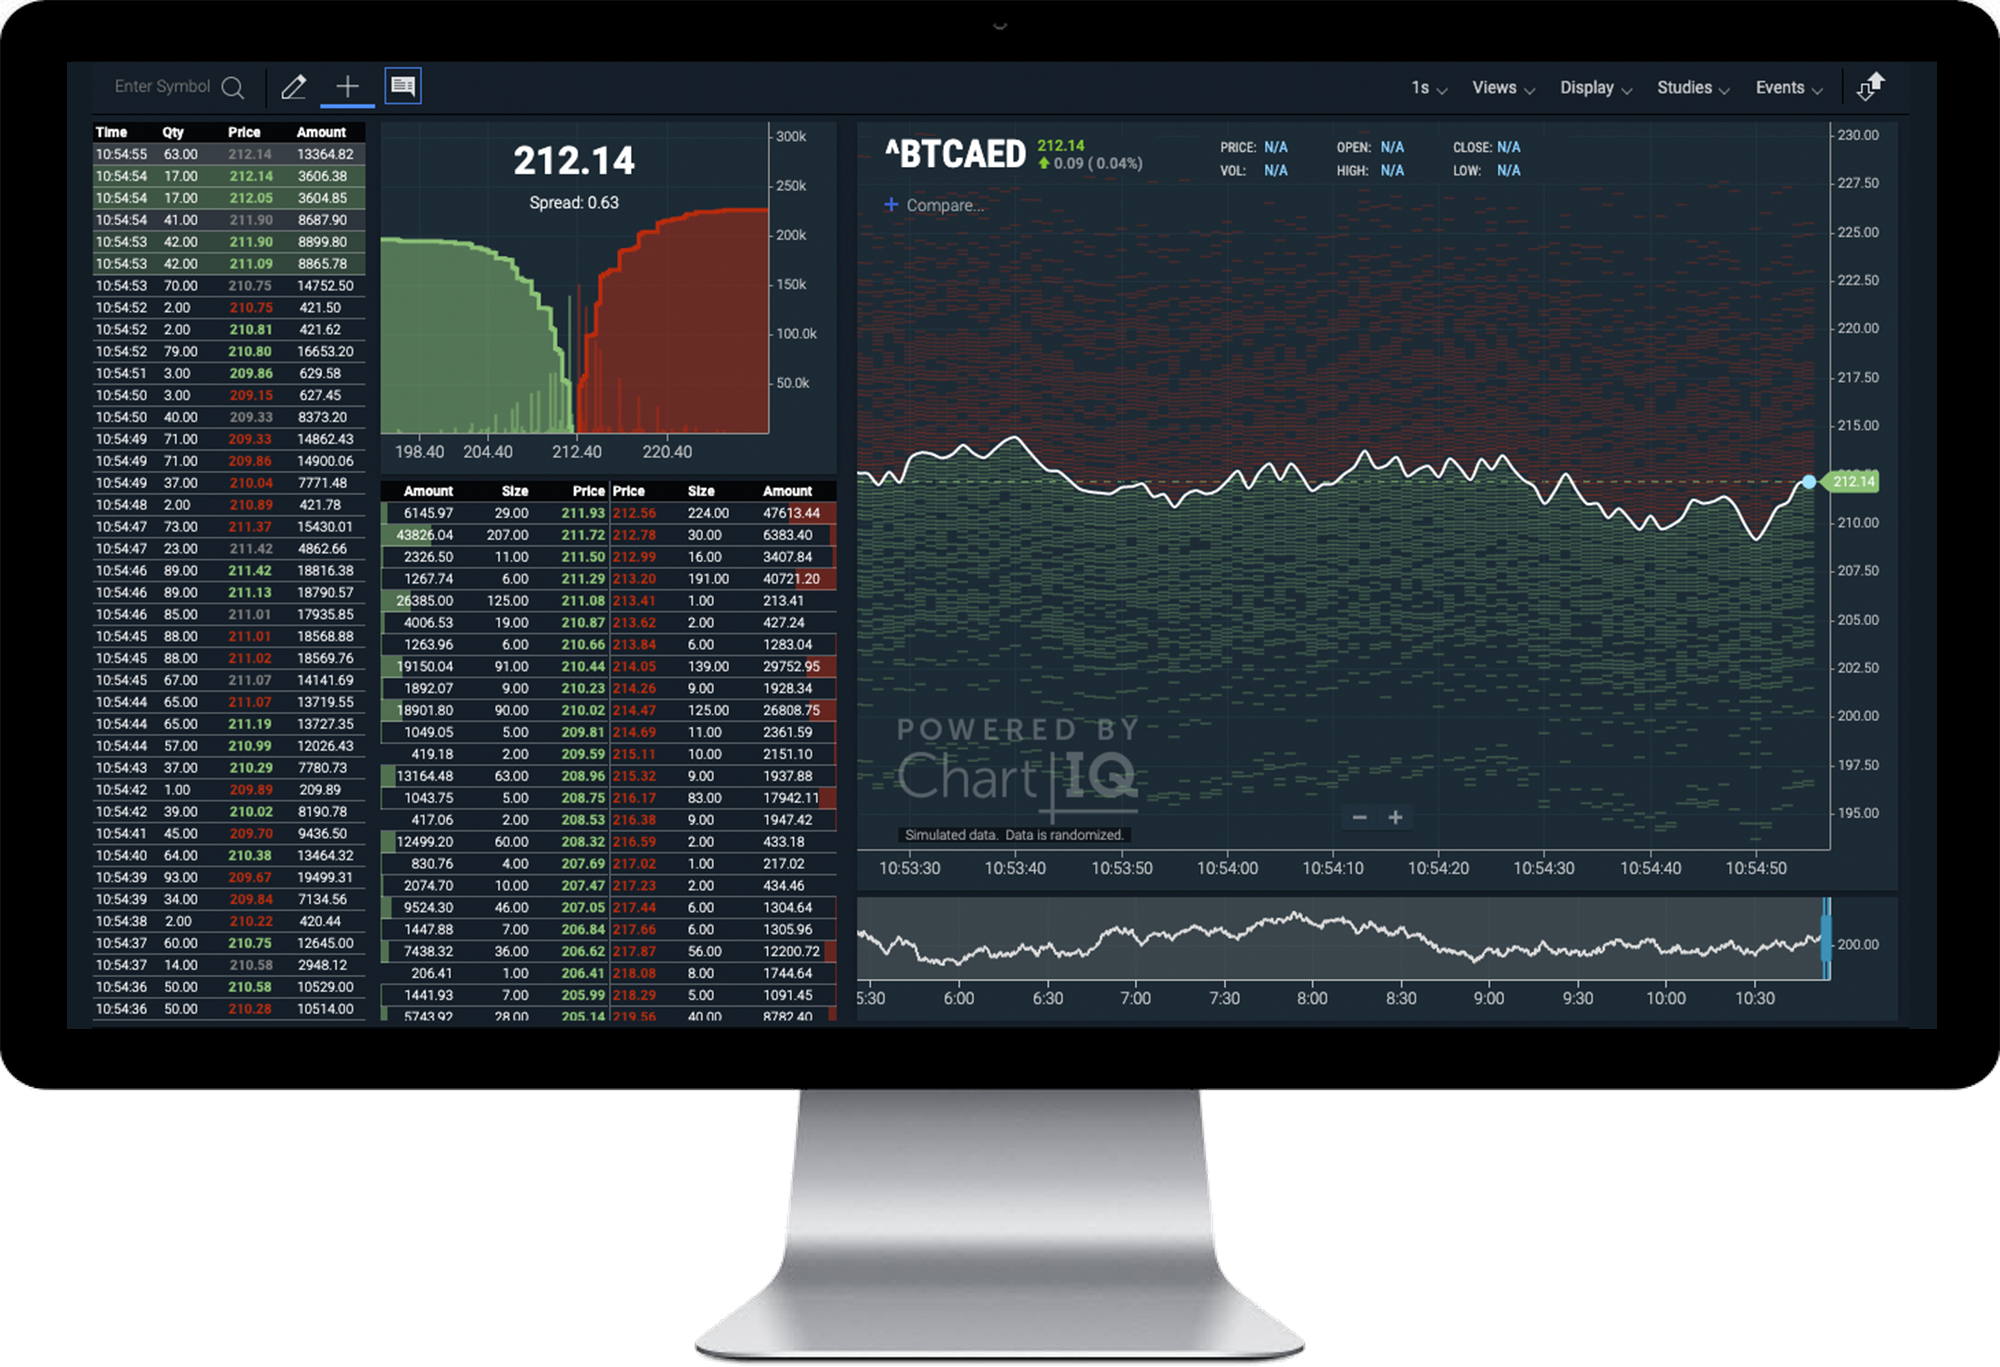
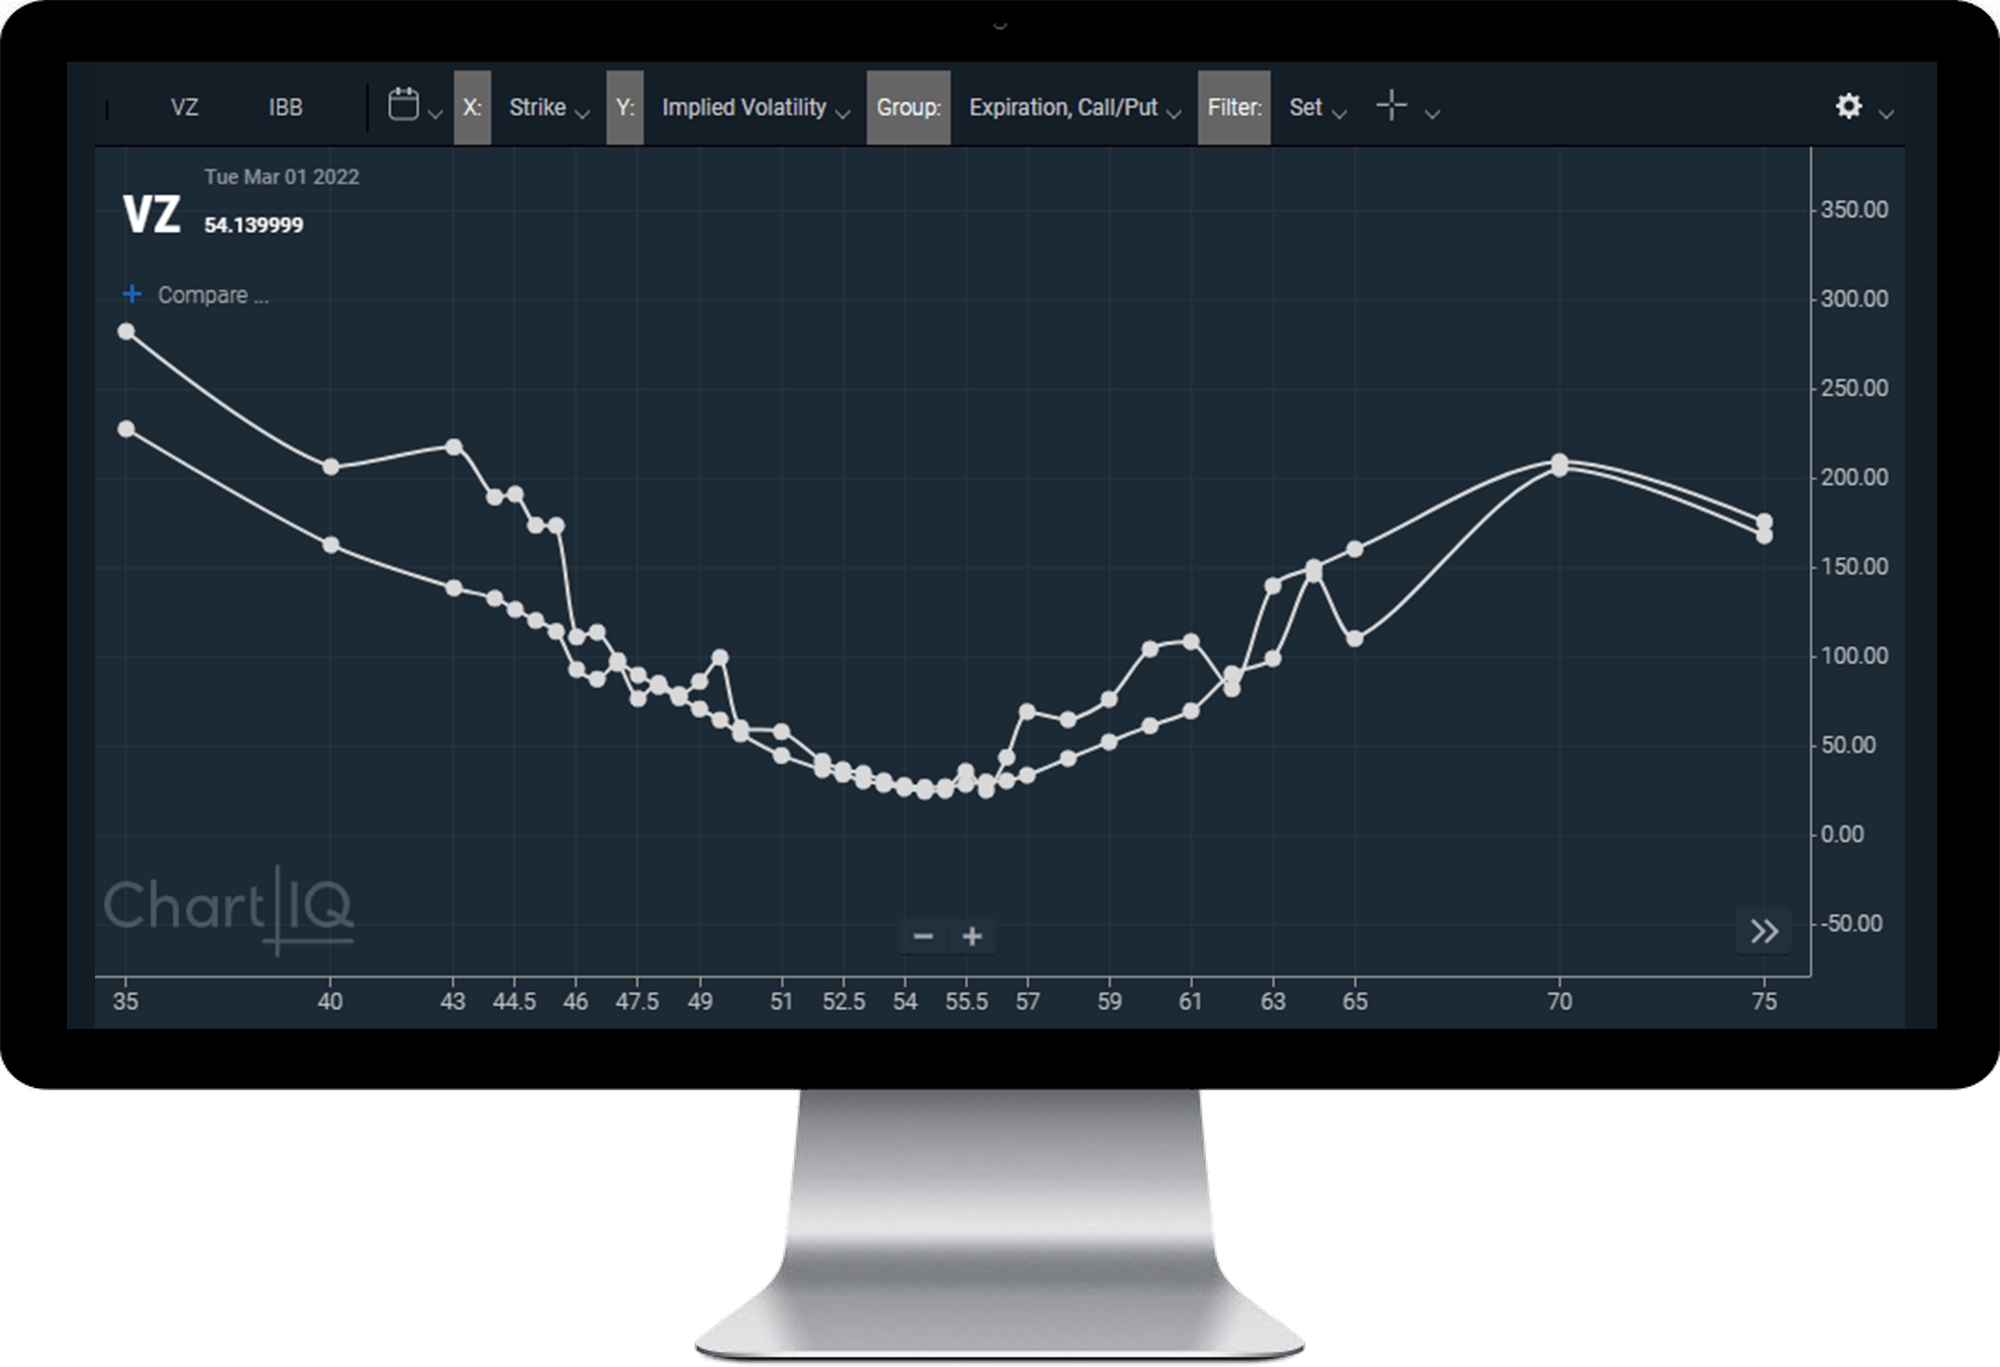
Move beyond traditional charts to custom data visualizations that intuitively explain and engage users with actionable, tradable data.

The ChartIQ Difference

ChartIQ is the first and only professional grade white label HTML5 Charting Library solution that works seamlessly within any application and on any platform (mobile, web, desktop) or framework (Angular, React) using a single library.

Satisfy Traders On-the-Go

A powerful interactive chart deserves the power of a native app experience. ChartIQ’s mobile version features everything ChartIQ users depend on in an easy-to-install application, optimized for native mobile app integration.

Utilize A Robust Software Development Kit (SDK)

ChartIQ is essentially an infrastructure toolkit, carefully thought through and built to provide unparalleled flexibility while maintaining ease of integration.

Integrate Your Data

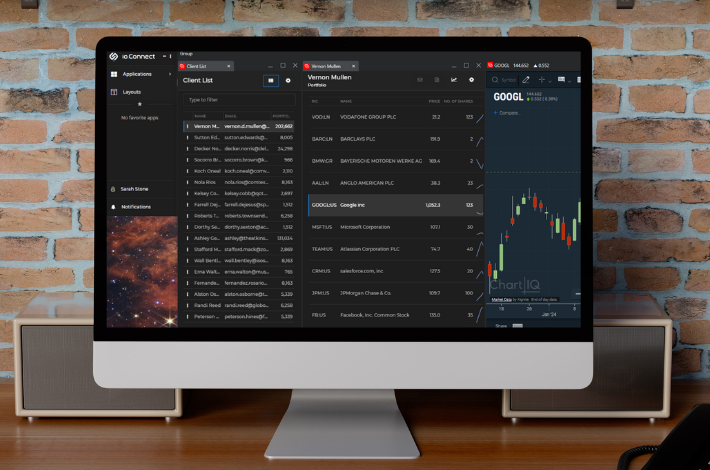
ChartIQ can source data from any feed or vendor – imagine your own data, beautifully rendered with little to no operational costs. ChartIQ simplifies this complex process and brings all your valuable data into one central interface and display for an easy-to-understand data dashboard.

Build Your Own ChartIQ

ChartIQ’s modular architecture allows you to provide traders of all levels with what they need to succeed. Expand your offering with premium modules such as Trade from Chart and CrossPlot.

ChartIQ Accessibility

ChartIQ includes pre-built accessibility features like tabbing and keyboard shortcuts. This means ChartIQ clients can begin to meet WCAG standards out of the box. Helping to make our clients’ solutions more accessible for their clients is a cycle of inclusiveness that makes ChartIQ a smart choice for firms looking to meet accessibility standards.


Blogs & Analysis


Exploring FDC3 and ChartIQ: The Future of Interoperability in Financial Services

Read More

Transformative Digital Solutions for Accessibility

Read More

Premier Options Platform Attracts New Users with Advanced Charting Tools

Read More

The Marriage of Two Best-in-Class Solutions Delivers a Significant Advancement in Data Visualization and Technical Analysis

Read More

Financial Data Provider Quickly Realizes Value of Upgraded Charting Solution

Request Follow Up

You're one step closer to unlocking our suite of financial information solutions and services.

Fill out the form so we can connect you to the right person.

We're proud of our recent awards!

  • Best Corporate Actions Data Initiative, 2023
  • Best Overall Sell-Side Technology Provider, 2023
  • Most Innovative Regulatory Solution (Climate Risk & Transaction Reporting), 2023
  • Best Overall Data Product or Service, 2023

And, we delight in supporting our customers with 24x7x365 customer service and a 98% customer service satisfaction rate.

If your company has a current subscription for S&P Capital IQ Pro, you can register as a new user for access to the platform(s) covered by your license at S&P Capital IQ Pro or S&P Capital IQ

Contact

  • Business Email *
  • First Name*
  • Last Name*
  • Phone *

Business

  • Company Name *

Location

  • City *
    • We generated a verification code for you:

    • Enter verification Code here?* Incorrect Verification Code

Thank you for your interest in S&P Global Market Intelligence! We noticed you've identified yourself as a student. Through existing partnerships with academic institutions around the globe, it's likely you already have access to our resources. Please contact your professors, library, or administrative staff to receive your student login.

At this time we are unable to offer free trials or product demonstrations directly to students. If you discover that our solutions are not available to you, we encourage you to advocate at your university for a best-in-class learning experience that will help you long after you've completed your degree. We apologize for any inconvenience this may cause.