
Panjiva’s 2019 Outlook series provided views on 25 separate global trade policy, logistics, and industrial supply chain topics. While we got many of those views right, we got some wrong – this report takes a look at what we got wrong and why, as well as (perhaps foolishly) trying to determine what happens next.
Car tariffs that never arrived
A major focus for U.S trade policy flagged in our January 2, 2019 research was the potential for disruption to the automotive sector from the Trump administration’s section 232 “national security” review of the industry. The review was never published, and it appears in hindsight it was little more than an attempt to force Japan and the EU to the negotiating table to form wider trade deals. A deal was reached with Japan, but not the EU.
The bigger issue for the sector has been weaker auto sales. Panjiva’s analysis of BEA data shows U.S. sales of foreign autos dropped by 4.1% year over year in the 12 months to October 31. That dragged imports down by 5.7% over the same period, Panjiva data shows. There’s been a slight improvement in the rate of decline recently with a 1.6% drop in sales and 0.9% slip in imports in the past three months, though that’s far from a turnaround.
Looking ahead there may be a return to tariff risk for the automotive sector as U.S. and EU relations remain in the balance. The time for the section 232 review has passed. Instead we may see the U.S. apply tariffs to the sector should EU attempts to implement a digital services tax continue. That could be particularly pertinent for Germany and Italy.
FOREIGN AUTOS STUCK IN REVERSE
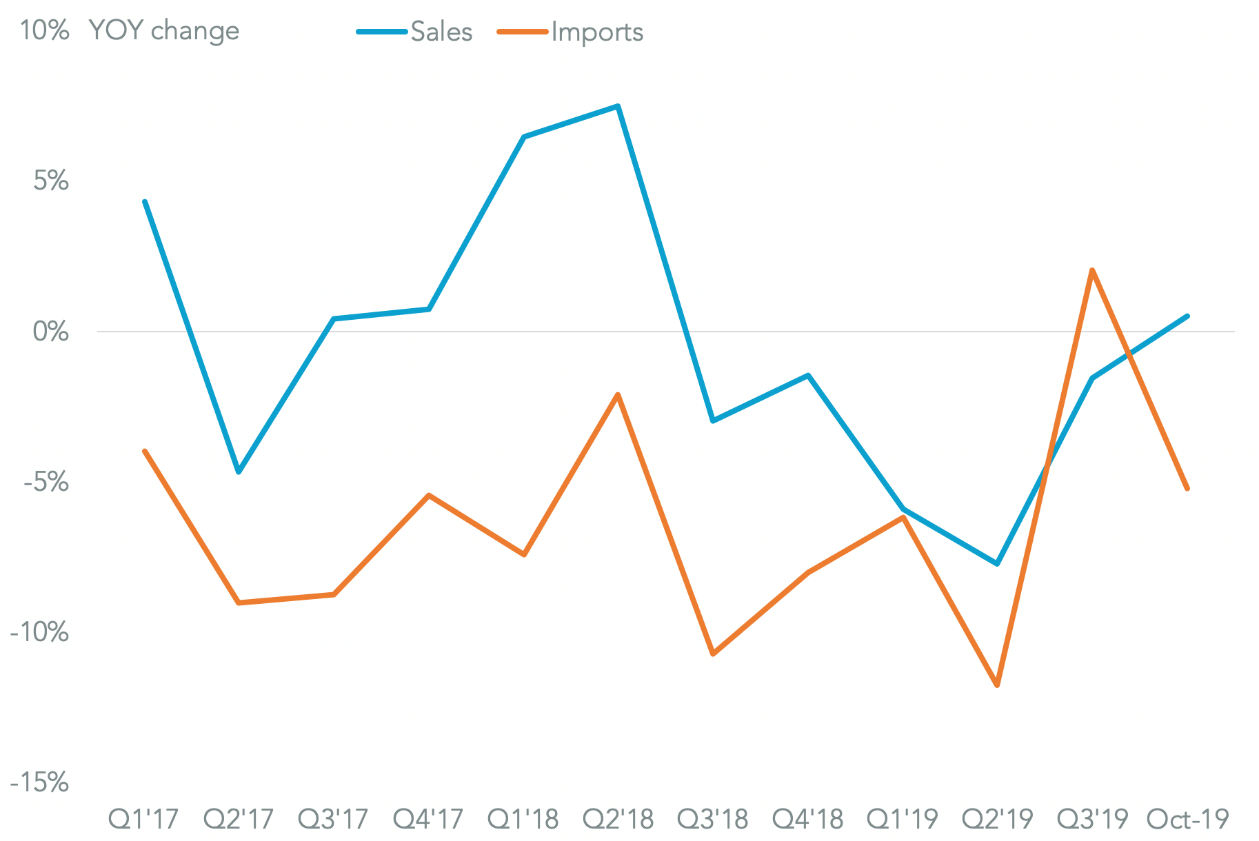
Chart compares U.S. sales of foreign-made autos to imports of vehicles. Calculations include BEA data. Source: Panjiva
Deficit dips without a formal trade war deal
We expected that the Trump administration would want a tangible win from a deal with China, including commitments from the latter to increase imports and cut the trade deficit. We were wrong for most of the year. Tariffs were widened repeatedly with a phase 1 trade deal yet to be signed despite President Trump’s commitments to do so by January 15, 2020.
The trade deficit with China has nonetheless declined by $41.9 billion in the 12 months to October 31 to reach $369 billion. Yet, the deficit versus the rest of the world has increased as U.S. consumption has remained strong and supply chains have reoriented to avoid China.
Looking ahead, the phase 1 trade deal should be formalized by mid-January, though the bulk of tariffs will remain in place. That should keep downward pressure on the trade deficit. Yet, rivalry between the U.S. and China looks set to remain for the long-run – U.S. plans to keep tariff exemptions in place through the rest of 2020 are a clear sign of plans in that regard. The bigger issue for the trade deficit may be the risk of a trade war between the U.S. and the EU.
TARIFFS WORKING AS PLANNED
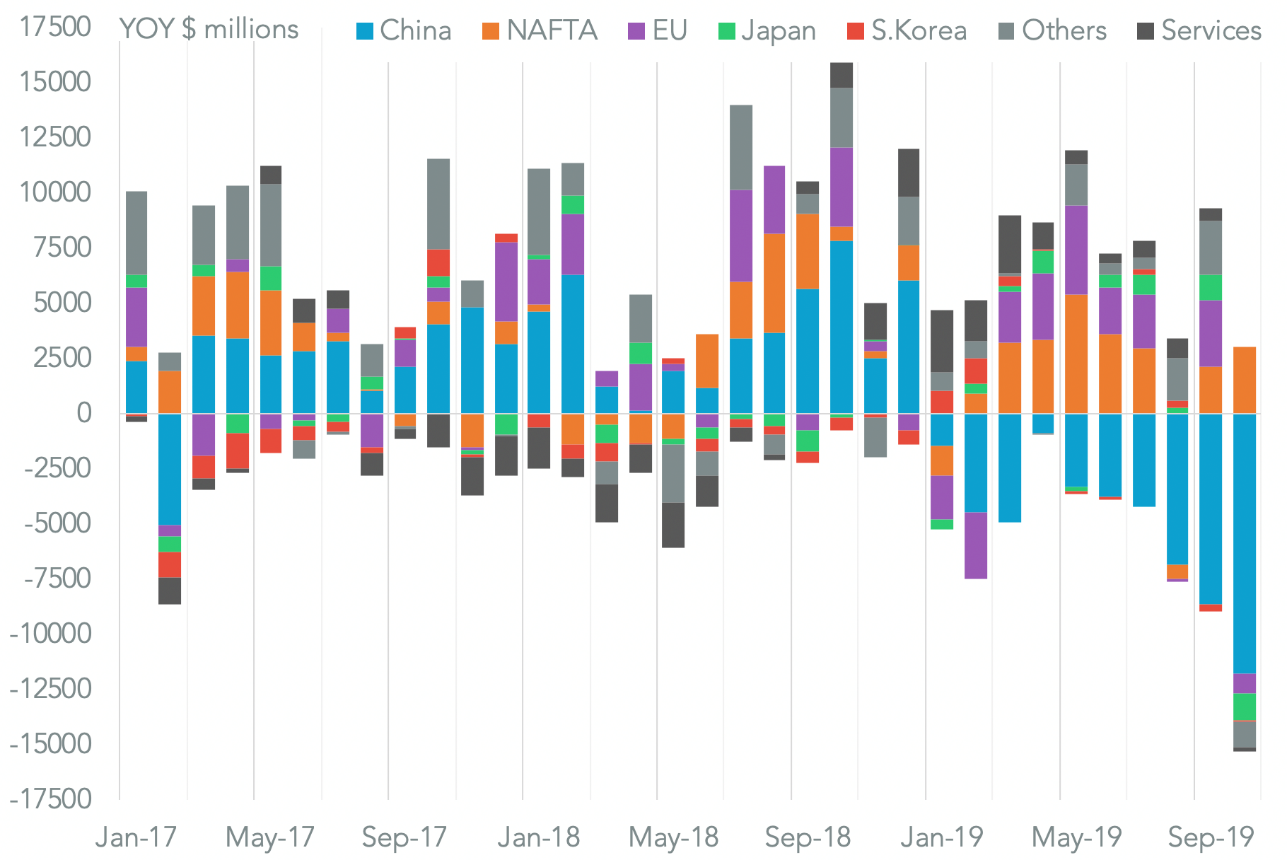
Chart segments change in U.S. trade deficit in goods by region as well as total services surplus change. Calculations include U.S. Census Bureau data. Source: Panjiva
RCEP gets there, for a given value of there
Our global policy prognostications were particularly problematic. We expected an initial pause in the Brexit process, but missed the second delay in October and subsequent renegotiation by the Johnson administration. Looking ahead, the path to Brexit is now set, though it remains uncertain as to whether a trade deal with the EU can be reached before the end of the year.
In Asia we saw the potential for an expanded CPTPP trade deal to make RCEP obsolete. In the end RCEP got to a deal-in-principle, but excluding India. Similarly, we didn’t foresee the growing friction between South Korea and Japan which derailed the expansion of CPTPP. The latter has also exacerbated the regional downturn in trade activity. Japanese exports to South Korea dropped by 17.0% year over year in November whereas its exports to the rest of the world fell by 14.4%. Similarly Japan’s imports from South Korea dropped 12.5%, versus a 4.2% slide versus all other countries.
Looking ahead, a recent heads-of-state meeting has opened the door to improved relations between South Korea and Japan. When combined with an emerging coalition-of-the-willing there is an improved chance that 2020 will be the year that RCEP finally gets over the line.
TRADE SPAT PROVIDES AN EXTRA DRAG TO JAPANESE ACTIVITY
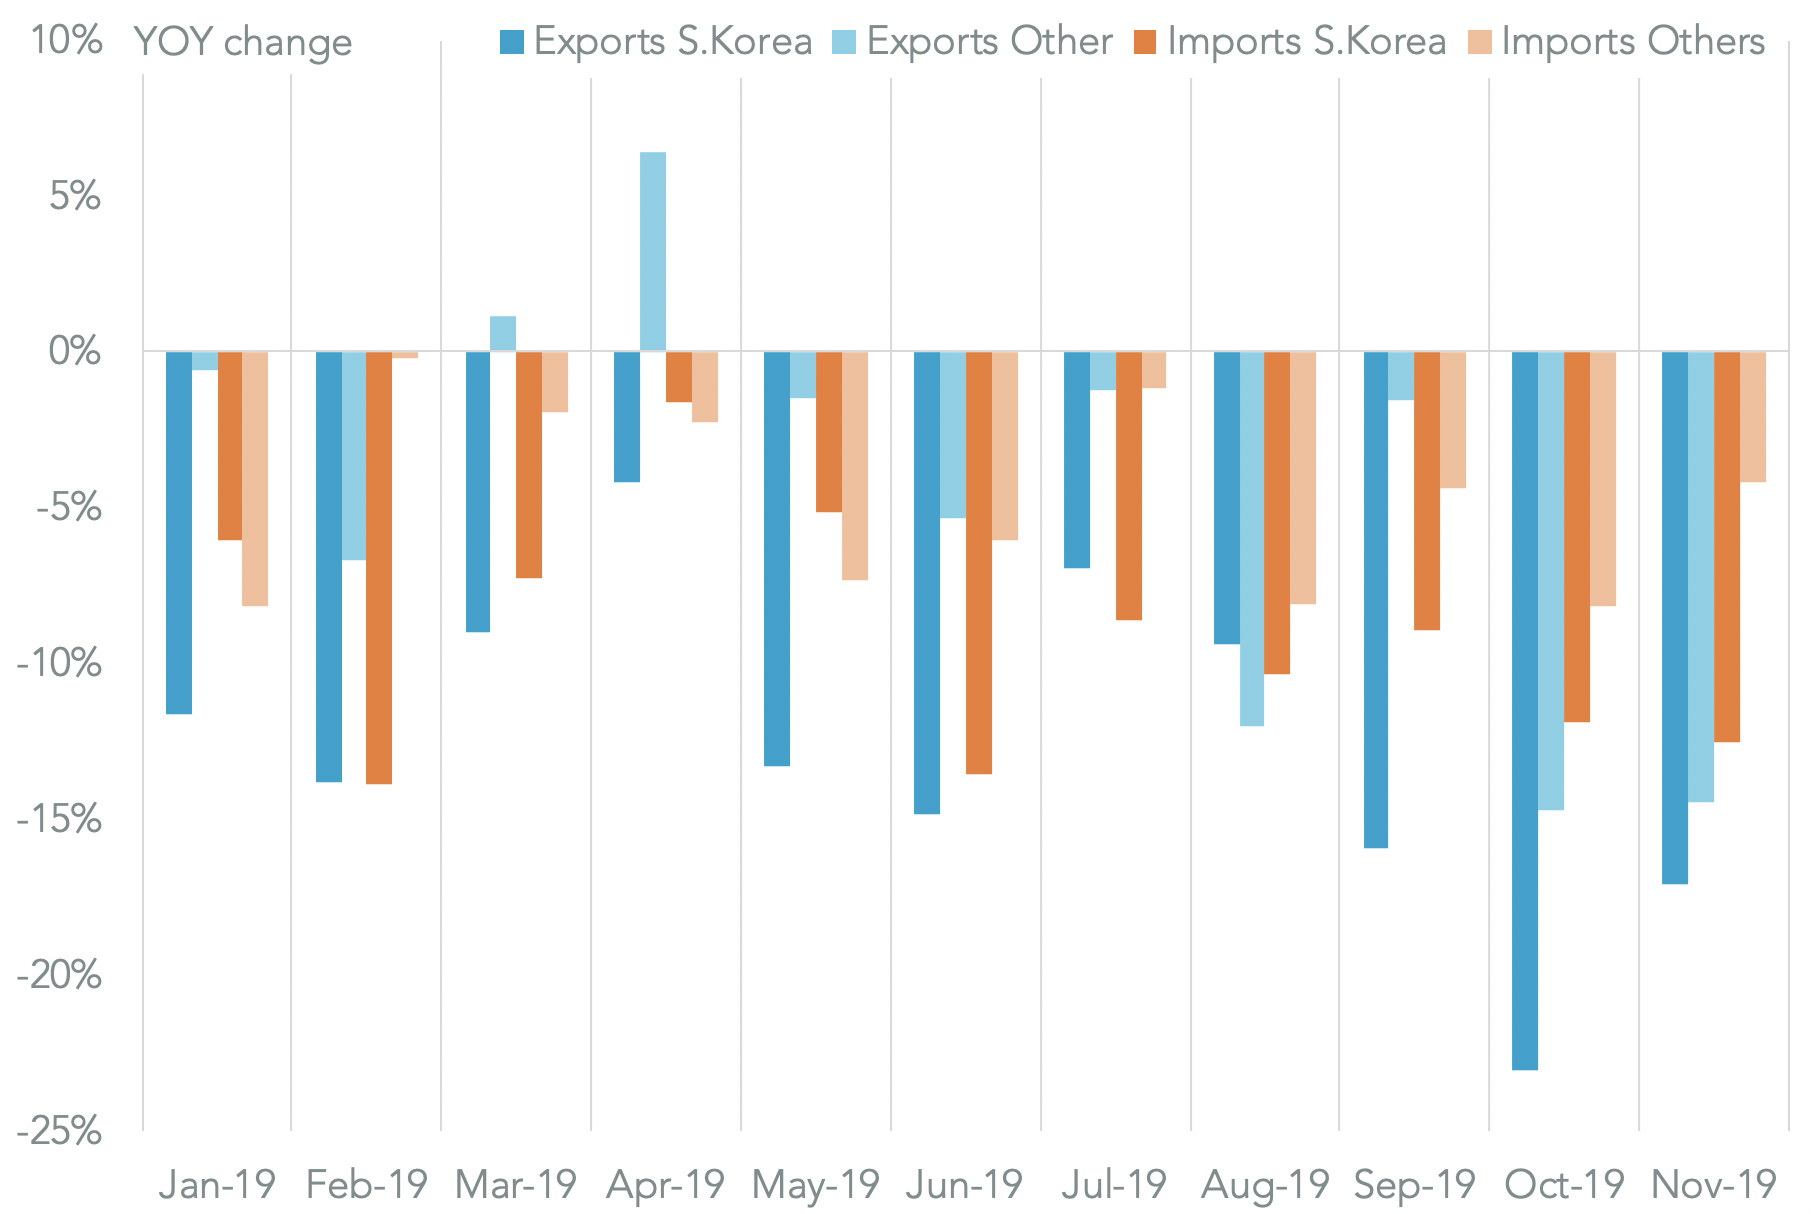
Chart segments change in Japanese trade by direction and counterparty. Calculations include Japanese Ministry of Finance data. Source: Panjiva
Modi stayed wedded to tariffs
We also expected that Prime Minister Modi would implement widespread import tariff cuts in order to boost the economy ahead of the elections. If anything the administration has doubled down on a tariff-led industrial policy, and has left RCEP in order to accommodate such a process. We clearly underestimated the centrality of trade controls to Modi’s economic development strategy, as well as a willingness to step back from multilateralism.
Importantly the tariffs have been working in cutting Indian imports as intended. Panjiva’s data shows there was a 23.4% year over year drop in imports of phones in the three months to August 31 as local production was built up by Apple among others. India has yet to capture the full value chain though with imports of semiconductors and circuits rising by 21.0% over the same period.
Looking ahead, there are indications that Indian tariffs may be extended further if anything. It’s unlikely post-elections that the short-term economic risks from the tax increase implied by higher duties will matter given the strength of Modi’s parliamentary position.
PHONE NUMBERS DOWN, COMPONENTS DIALLED UP
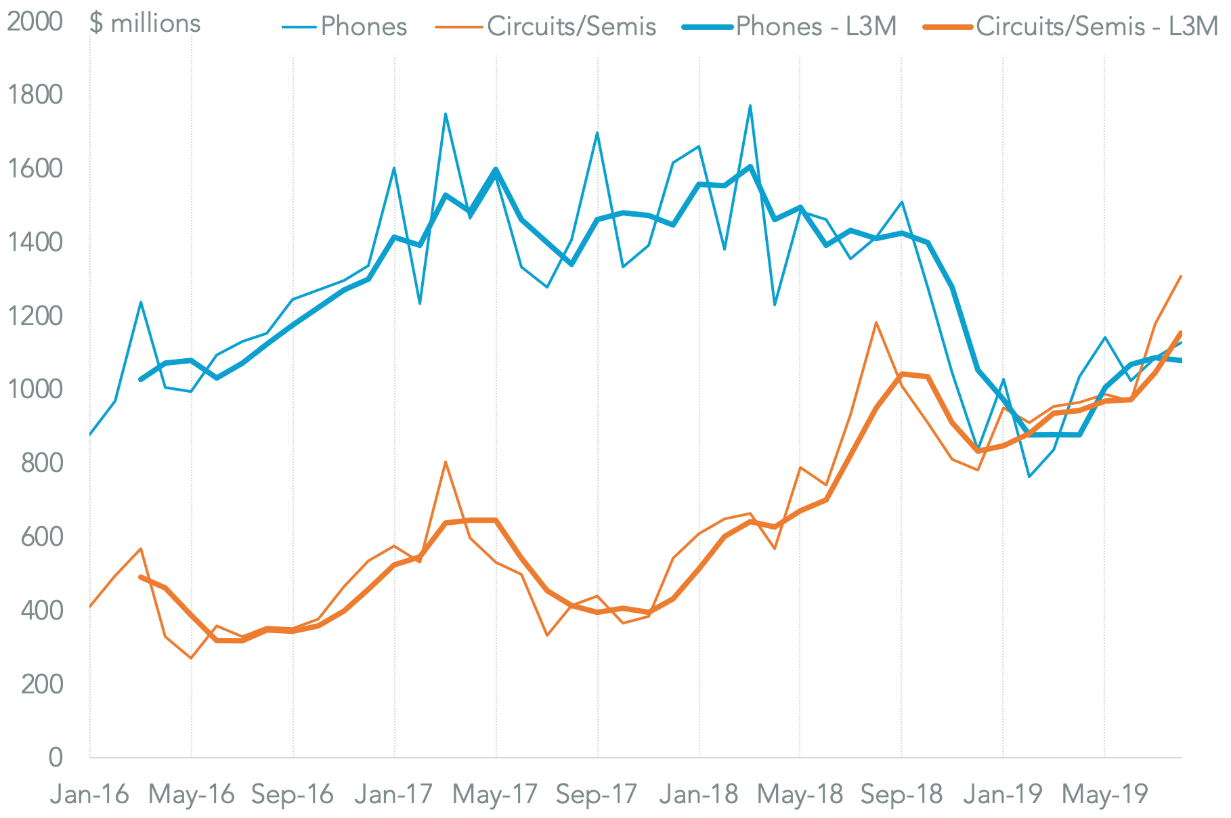
Chart compares Indian imports of phones and electronic circuits on a monthly and three-month average basis. Source: Panjiva
Passing bout of container indigestion
Congestion at U.S. seaports, which had disrupted supply chains in late 2019, got better rather than worse. That’s particularly been the case in the most recent peak season due to the impact of the U.S.-China trade war. U.S. seaborne imports in 1Q 2019 dropped by 11.2% sequentially after rising by 1.9% sequentially and by 8.5% year over year in 4Q18.
The subsequent implementation of tariffs has meant that 4Q 2019 has seen an 8.0% drop sequentially and an 8.5% slide versus a year earlier.
Looking ahead, there is likely to be a continued downturn in container freight activity as we move into the off-peak season. Outwith a marked cut in tariffs by the Trump administration it is unlikely that there will be a return of the congestion challenge in the near term.
WEAKER ACTIVITY OFFSETS CONGESTION CHALLENGE
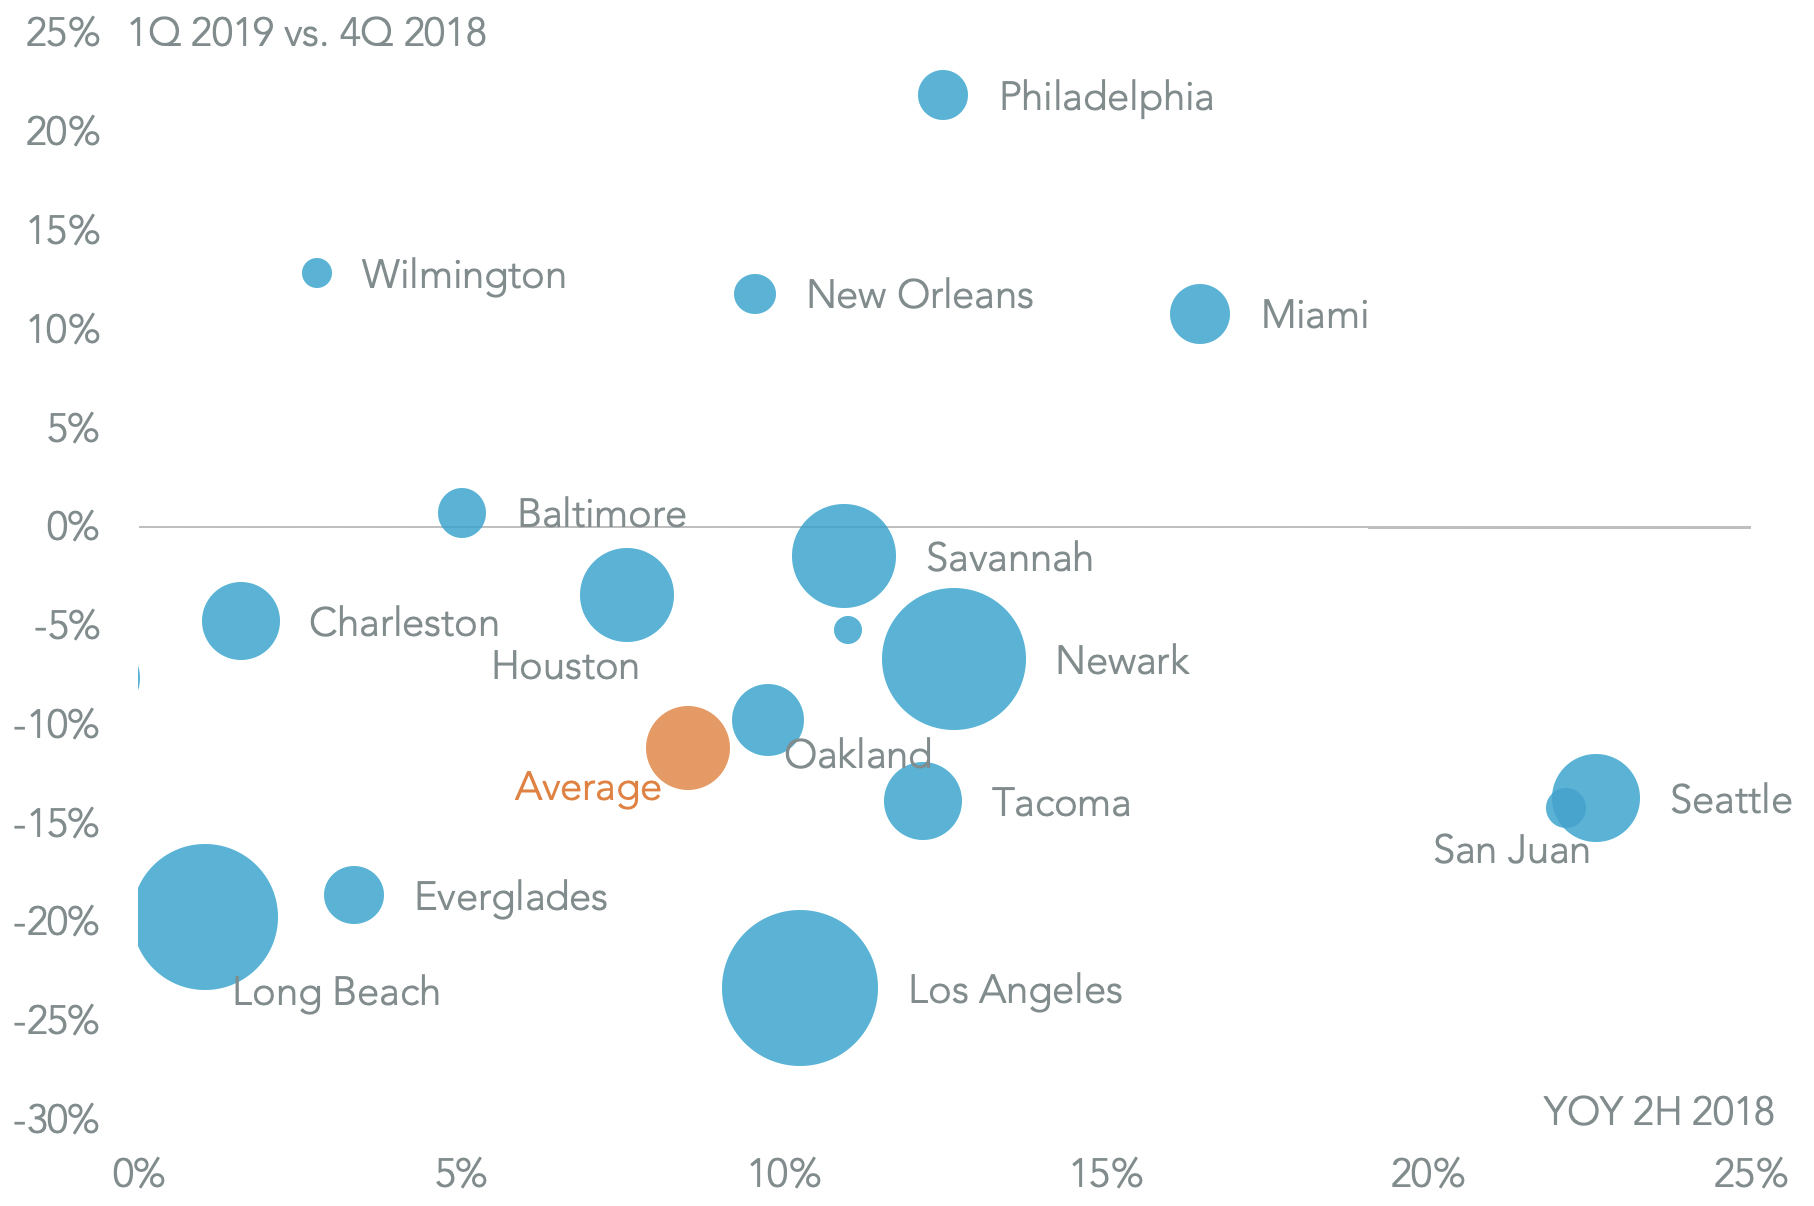
Chart segments change in U.S. seaport activity by port. Bubble size indicates total volumes handled. Source: Panjiva
Only one black swan hatched, and it was a nightingale
Thankfully the only black swan that worked out was the risk of disruptions in the Middle East, though even that didn’t develop the way we expected. There wasn’t a closure of the straits of Hormuz but there were oil interruptions due to a drone strike in Saud Arabia. That’s come at the same time as reduced U.S. reliance on oil imports.
Saudi Arabia has already been one of the major losers from U.S. energy independence with a 90.0% year over year drop in oil shipments to the U.S in 4Q, including zero shipments in September, November and December. Other suppliers have done better including a modest 1.0% slip in shipments from Mexico and Canada in 4Q, in part to offset a sanctions-related slump in shipments from Venezuela.
Looking ahead, there are signs that this black swan may be a nightingale (the national bird of Iran) with Iran-U.S. tensions rising following recent events in Iraq, reported by the Financial Times. If anything, the exposure of U.S. seaborne oil imports to Hormuz has increased with 4Q from shipments from Persian Gulf countries aside from Saudi Arabia having risen by 5.0% year over year in 4Q.
U.S. ENERGY INDEPENDENCE REDUCES SANCTIONS, CONFLICT RISK

Chart segments U.S. seaborne imports of crude oil by origin on a monthly and three-month average basis. Source: Panjiva