
Organizations understand how important data is to their decision-making and effectively leveraging data has become an accelerator of business growth. Market uncertainties and competitive pressures have increased the focus on long-term viability for corporations, making relevant data a critical asset needed to stay aware of key developments. Having access to more data is not the answer, however ― it is having access to the right data.
Business analysts across all industries gather, analyze and interpret vast amounts of qualitative and quantitative data to answer questions and solve problems. Information is used to form insights that enable analysts to support internal groups, such as sales when targeting a specific geographical region or segment, strategy when evaluating potential risks and opportunities and finance when understanding company performance relative to competitors. With the abundance of information available, sourcing reliable data and having the appropriate tools to effectively analyze it is paramount to an analyst’s workflow. This is why the S&P Global Marketplace Workbench ("Workbench") is an essential tool for data access, collaboration and visualization, enabling users to deliver impactful and unique solutions to their businesses.

Needs
Many analysts want the ability to test and experiment with data prior to purchasing it to ensure it is applicable to their business needs, can be integrated into their workflows and provides the unique insights they are seeking.
When working with external data providers they prefer to:
- Access a wide range of reliable data from a single trusted source.
- Leverage a cloud-hosted environment, avoiding local installation and internal security review.
- Perform data analysis and build data models and workflows in a collaborative environment.
- Evaluate external data alongside their own data to assess relevancy.
- Have support for multiple programming languages enabling analysts with different technical skills to work together.
- Collaborate with team members with the ability to leave live comments for each other, track revisions and restore older versions.
The Solution
S&P Global offers the ability to explore available datasets and solutions via S&P Global Marketplace, the single data discovery platform that includes data and solutions from across all five divisions of S&P Global, in addition to Sustainable1, Kensho and curated third-party providers. Data available for exploration includes public and private company financials, estimates, global transactions, company key developments and sustainability data, which can be linked using the powerful and proprietary cross-reference service, and more.
After identifying relevant datasets, users can trial the data via Workbench, a platform powered by Databricks that enables users to test, explore and experiment with datasets from S&P Global and curated third-party providers. Workbench is built from cutting-edge technology providing scalable, secure and cloud-hosted access via a web browser, eliminating the need for local installation or data transfer, storage or maintenance. With this platform, users can create web-based notebooks in the coding language of their choice (i.e., Python, SQL, R or Scala), as well as share code, visualizations and explanatory text with their colleagues, driving collaboration. Built by leading data experts from S&P Global, Workbench offers:
- Starter Guide notebooks that provide basic information to help users understand how to navigate through S&P Global data (e.g., a dataset overview and schema), introductory queries to filter datasets (e.g., historical or geographical coverage and data items available) and use case queries to answer specific business questions.
- Workflow-driven notebooks that recognize that decisions are not made with discrete datasets, but instead when multiple datasets are combined to spark new thinking. These notebooks provide details on specific ways in which datasets can be used to drive future business insight.
- Built-in data visualizations tools, as well as the ability to integrate open-source graphing libraries such as Plotly, which facilitate the creation of charts directly from a Pandas data frame.
A Sample Notebook with Visualizations[2]
The goal of this sample notebook is to demonstrate how users can seamlessly link multiple datasets in one environment and create unique and relevant visuals with Plotly, an open-source graphing library in Python. This sample notebook contains five sections:
- A high-level view of the financial services sector.
- A focus on banks.
- Insights from earnings call transcripts.
- Building a network chart.
- A look at liquidity.
1. A high-level view of the financial services sector
Figure 1 below shows the code and results for all U.S. public companies that are part of the financial services sector.
Figure 1: Query showing U.S. public companies in the financial services sector.
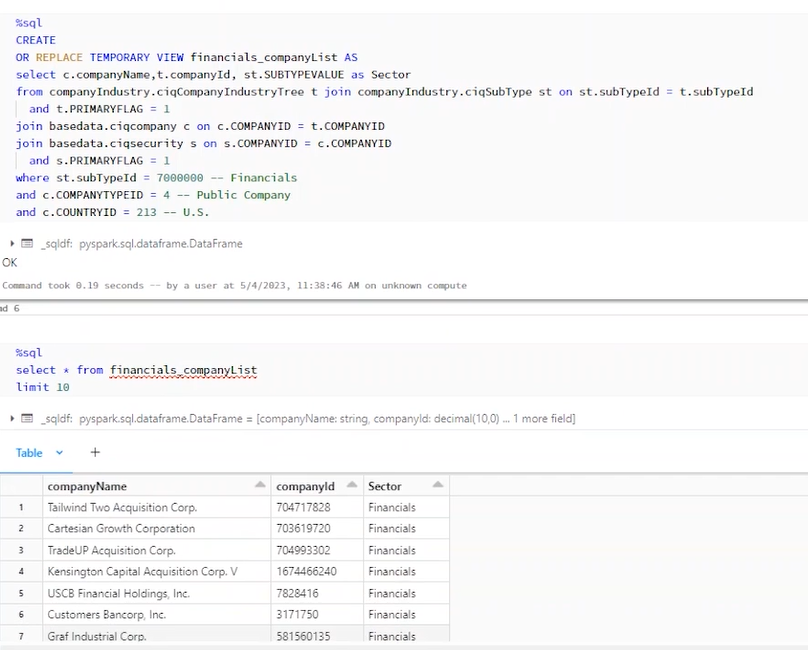
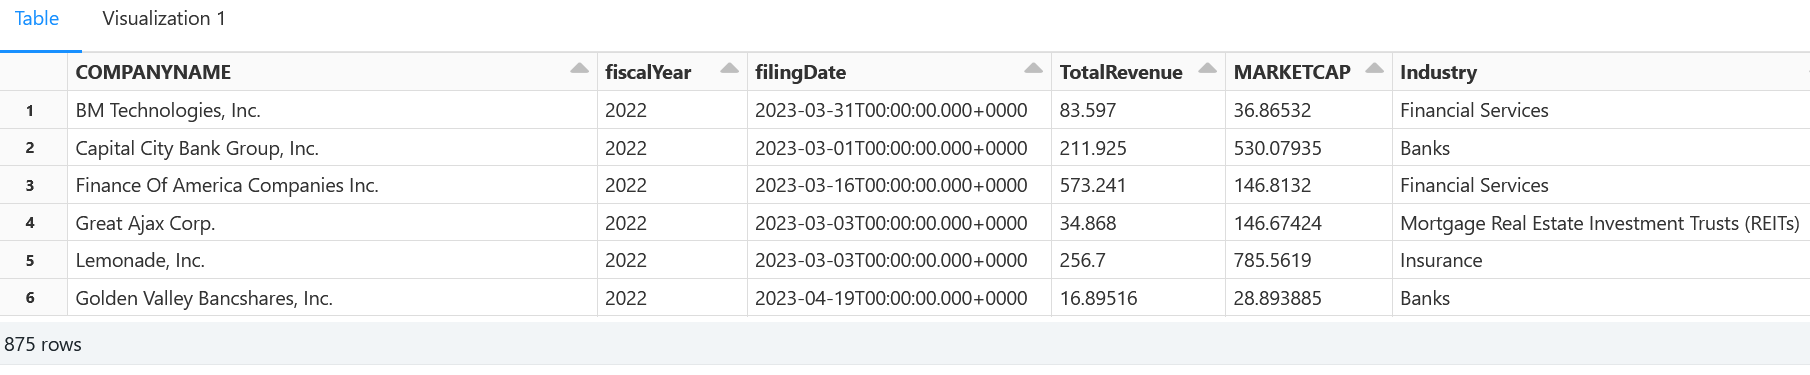
Next, we bring in details on Total Revenue, Market Capitalization and Industry from the S&P Capital IQ Financials, Market Data and Company Industry datasets.
Figure 2: FY 2022 Total Revenue, Market Capitalization and Industry.
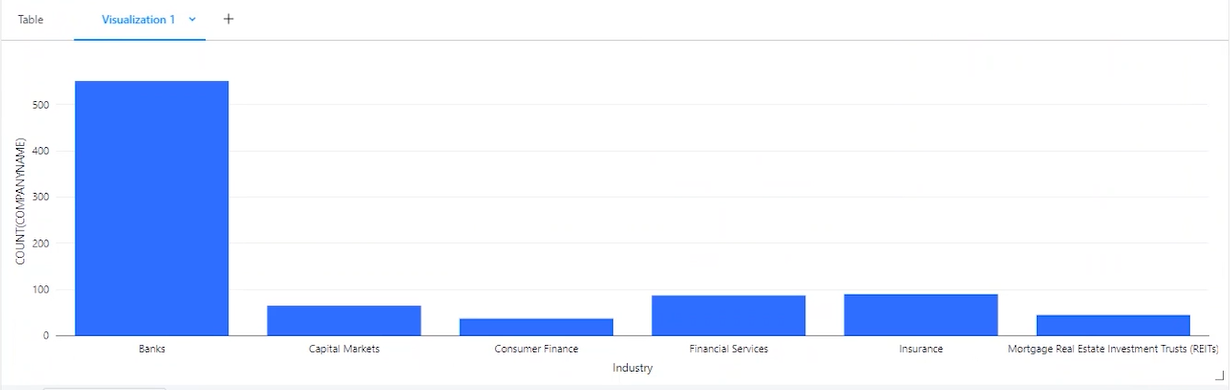
As shown in Figure 3 below, Workbench provides a pre-built drag and drop visualization, revealing that the bank segment contains the highest number of companies when compared to other segments within financial services.
Figure 3: Number of companies in each segment.
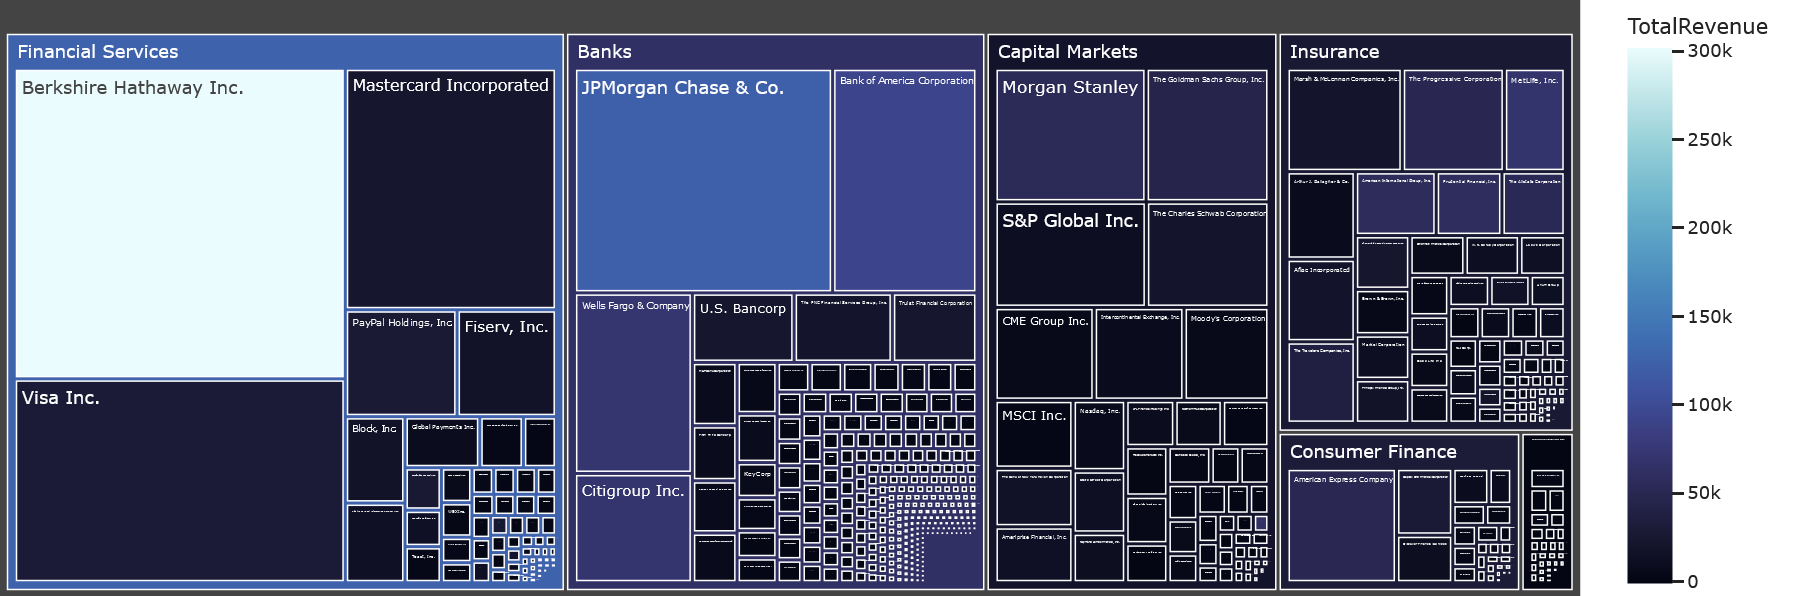
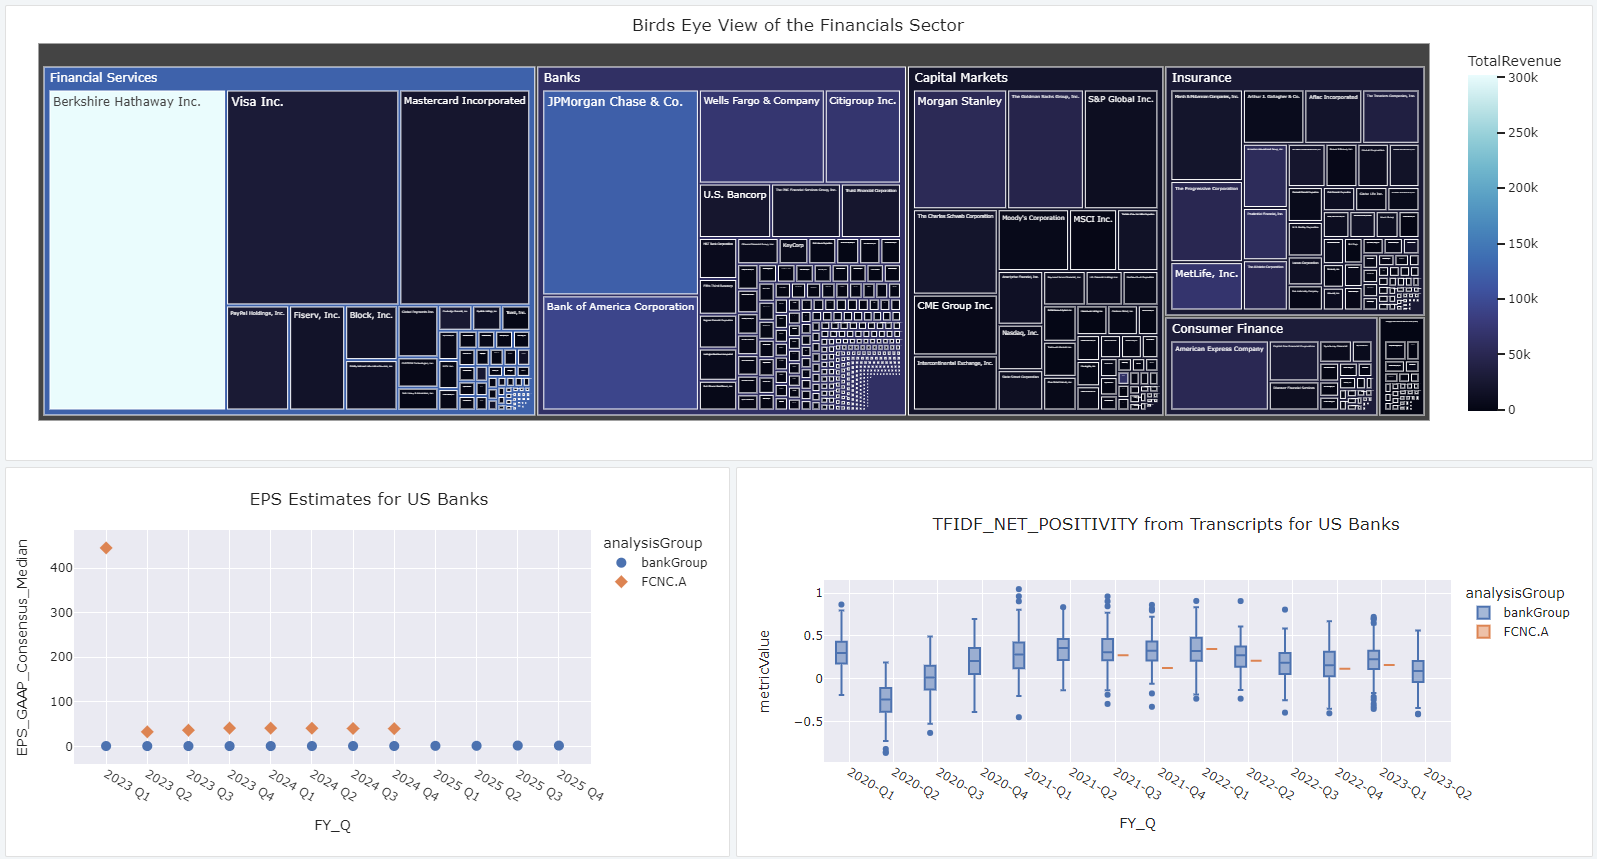
To dig deeper into Figure 3, we can look at additional details by company within each industry, where the size of the square in Figure 4 below indicates Market Capitalization and the color indicates Total Revenue (i.e., the lighter the color the higher the revenue). Berkshire Hathaway has the greatest FY 2020 Total Revenue compared to its peers. The “Big 4” banks (i.e., JPMorgan Chase & Co, Bank of America Corporation, Wells Fargo & Company and Citigroup Inc.) have a large portion of the market share in the bank universe.
Figure 4: A bird's eye view of the financial services sector.
2. A focus on banks
Now we can look at all public companies in the U. S. that are part of the banking segment and pull in Earnings Per Share (EPS) Median Consensus Estimates from the S&P Capital IQ Estimates dataset. We enter the code using Spark SQL, and then do another drag and drop visualization as shown in Figure 5.
Figure 5: EPS for banks.
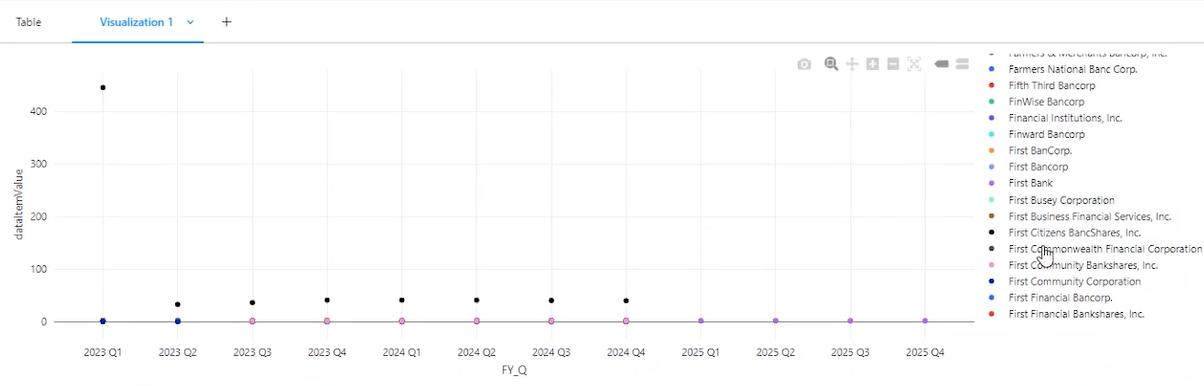
In Q1 2023, a datapoint stands out in the upper left-hand portion of the graph. This is for First Citizens BancShares ("First Citizens"). We dig deeper into the trend for First Citizens in Figure 6, aggregating the underlying data. This is completed by taking an average of the EPS Consensus Median for all banks in the bank universe and comparing the result to First Citizens.
Figure 6: Timeline of Consensus Estimate for EPS for First Citizens compared to the bank group.
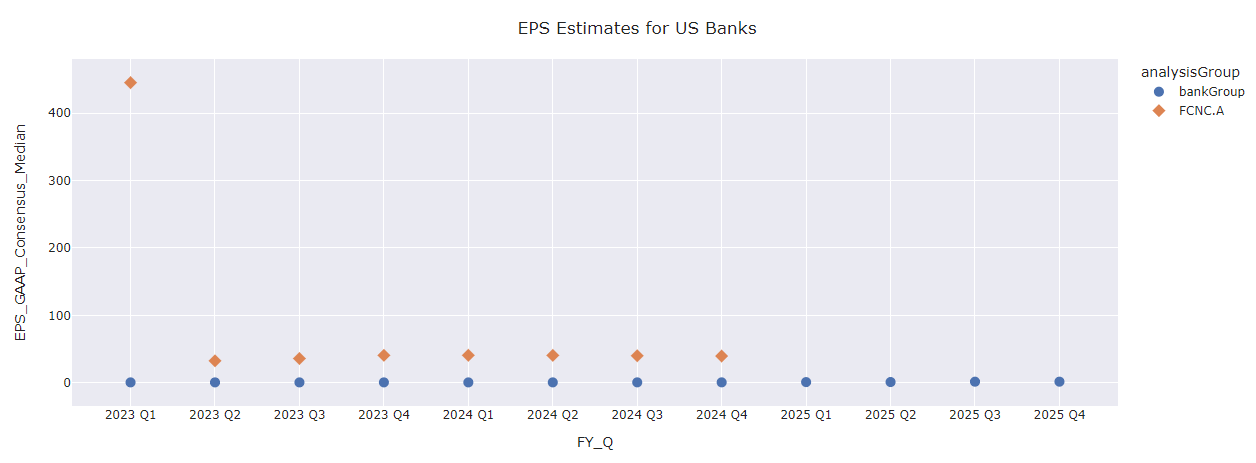
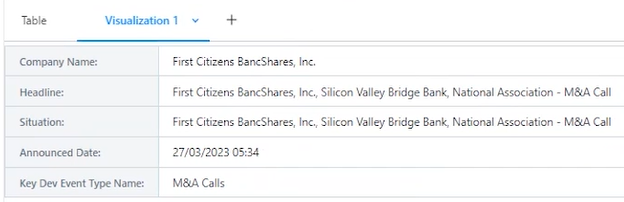
Adding details from the Key Developments dataset helps explain why First Citizens had a sharp increase in the consensus estimate for its EPS: the bank submitted a bid to acquire troubled Silicon Valley Bank's deposits, loans and branches.
Figure 7: Details from the Key Developments dataset.
3. Insights from earnings call transcripts
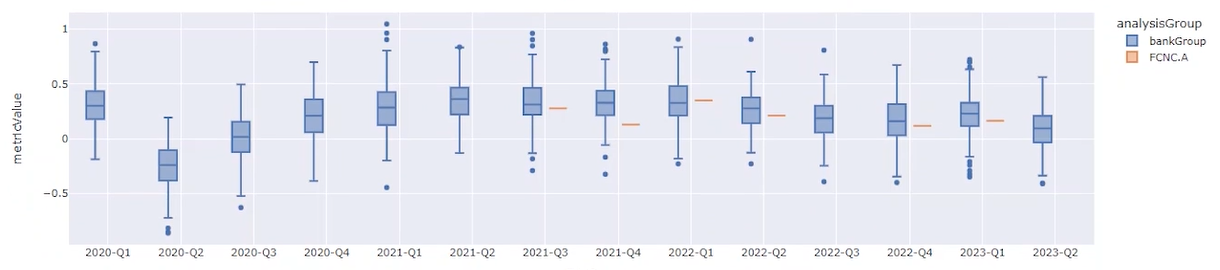
We can create a box and whisker plot for TF-IDF Net Positivity (i.e., term frequency-inverse document frequency weighted average net positivity that can serve as a measure of sentiment). We see that there was a significant decrease in TF-IDF net positivity for U.S. banks around the time of COVID-19 and, for the most part, First Citizens was in line with its peers (see orange line).
Figure 8: TF-IDF Net Positivity from earnings call transcripts for U.S. banks.
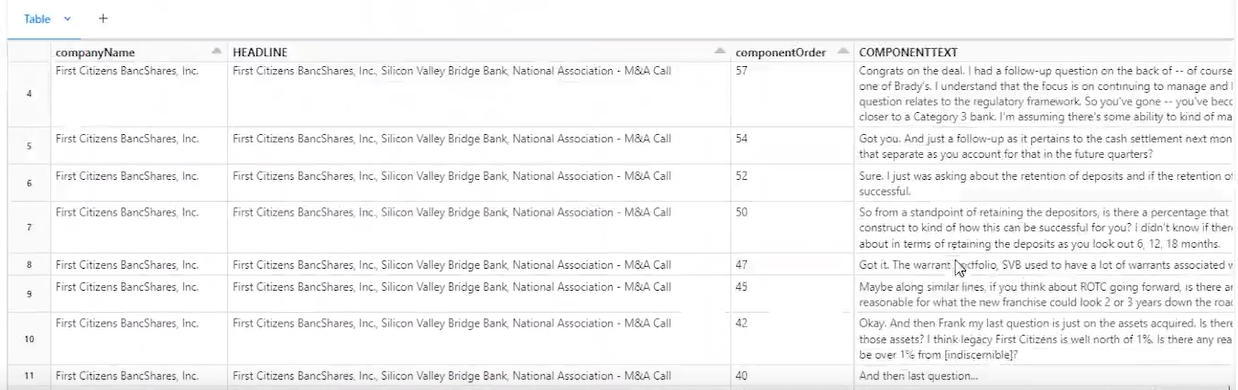
We can also see the component text from analysts in First Citizen's M&A call. In addition, the text can be tagged back to the contributor. This component text can be leveraged in Natural Language Processing (NLP) workflows.
Figure 9: Text from earnings call transcripts.
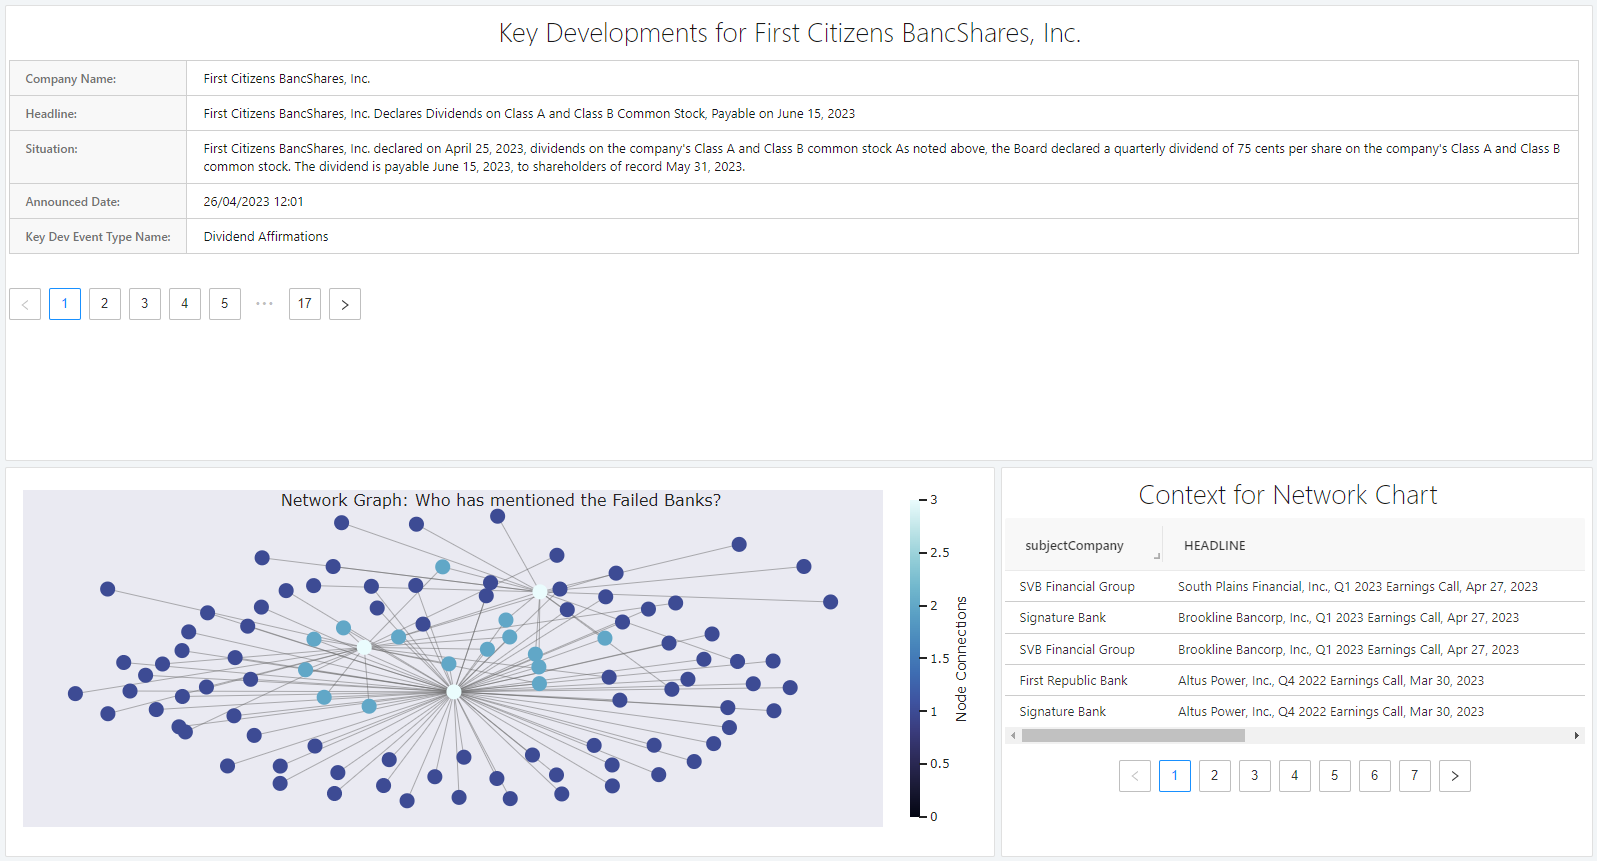
4. Building a network chart
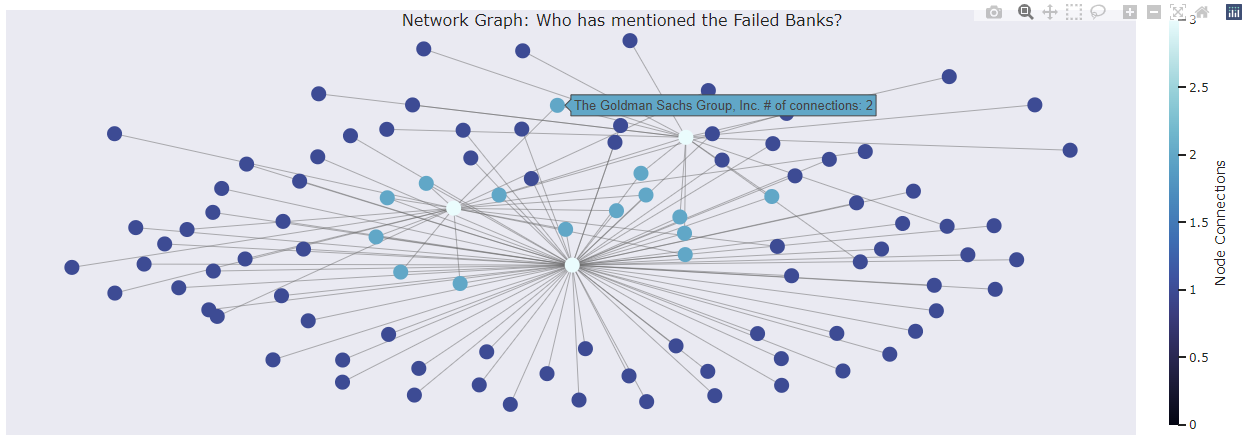
Using the Transcripts and Events datasets, we pull all events where Silicon Valley Bank, First Republic Banks or Signature Bank had been mentioned. Then, we create a network chart leveraging NetworkX and Plotly. This chart shows the number of companies that mentioned the three failed banks, with the teal-colored nodes indicating that an entity mentioned more than one of the failed banks. For example, Goldman Sachs mentioned both First Republic Bank and Silicon Valley Bank.
Figure 10: Network chart.
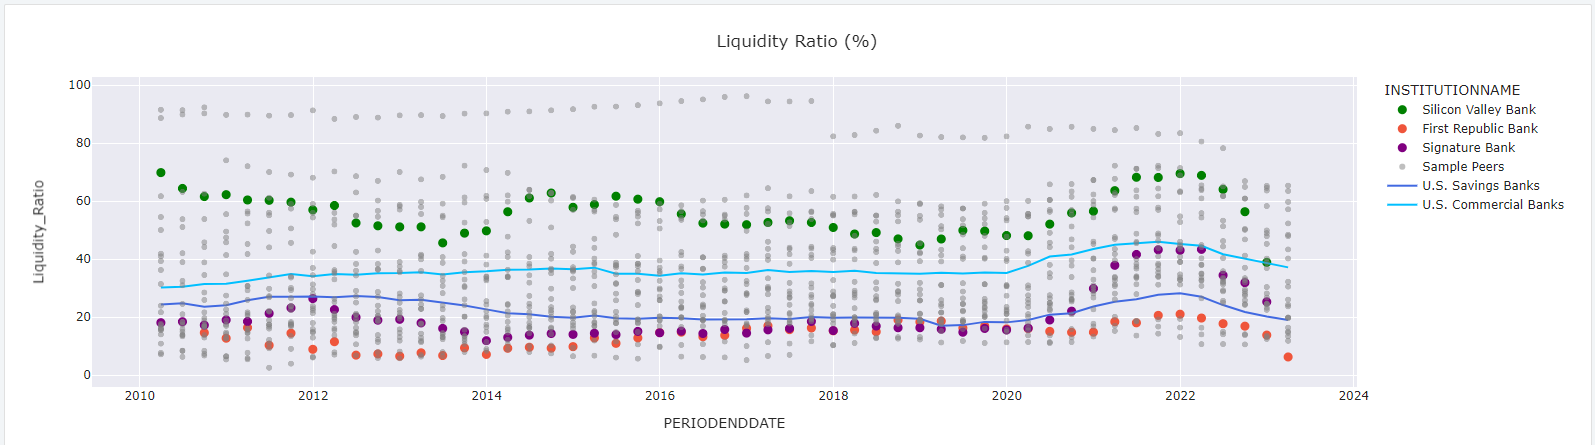
5. A look at liquidity
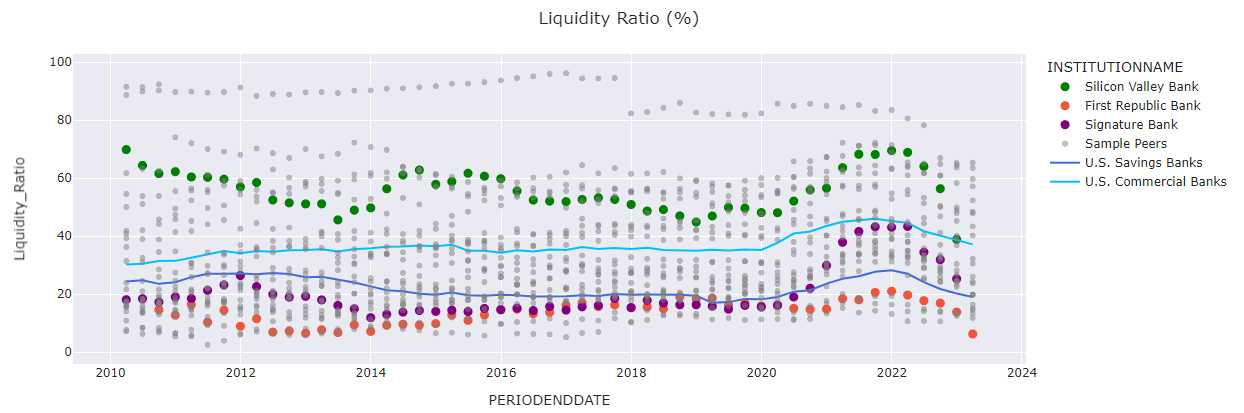
Finally, we pull data to create a liquidity ratio chart, looking at the three recently failed banks (i.e., Silicon Valley, First Republic and Signature Bank) relative to U.S. savings banks and commercial banks overall.
Figure 11: Liquidity ratios (%).
Importantly, all the visualizations created within this notebook can be dragged into a dashboard, with everything being completely interactive to drill into details in each visualization.
Figure 12: Sample financial dashboard.
Key Benefits
With Workbench, analysts can test, query and visualize data in one place for a seamless data exploration and analysis experience. There is no need to maintain databases, as users can simply log in and have production-ready data at their fingertips. Workbench also enables users to:
- Review an extensive set of best-in-class data from S&P Global and curated third-party providers that covers everything from competitor analysis to supply chains to sustainability performance to private credit markets.
- Easily analyze and review 70+ pre-built notebooks[3] by S&P Global data experts or build their own to better understand and see first-hand the value of various datasets.
- Have multi-language support in a single notebook, inclusive of Python, R, SQL and Scala, with interoperability between programming code that is executed in different languages.
- Automatically version control code, text and data to keep track of changes that have been made across team members and enable users to collaborate across notebooks in their company's own secure and scalable workspace.
- Create tables, charts, dashboards and more to identify correlations and capture the power of the data. Plus, use built-in data visualizations from Databricks and integrate open-source graphing libraries, such as Plotly, to facilitate the creation of charts directly from a Pandas data frame.
- Connect to business intelligence/reporting tools, such as Tableau and Power BI, using a Databricks connector.
- Benefit from easy data access in a scalable and secure cloud-based environment, with no installation required.
S&P Global has been awarded the Databricks Marketplace Financial Services Partner of the Year for 2023.
Click here to explore the S&P Global Marketplace Workbench.
[1] For illustrative purposes only.
[2] All visuals are sourced from S&P Global Market Intelligence. For Illustrative purposes only.
[3] Numbers as of November 2023.