
This is the first in a series of three blogs on risk trends.
Almost a year ago, we started a series of articles centered on analysing the credit risk trends of non-financial corporates as seen through our suite of quantitative models. The publication of the articles was a natural response to the onset of the COVID-19 pandemic and its implications for the creditworthiness of corporates based in the Middle East, Africa, India, Turkey, and other emerging economies in Europe and Asia. In this three-piece blog, we again focus on the creditworthiness of corporates, however, this time we have the ability to look at the corporates in our sample based on their year-end 2020 financials (i.e., income statements and balance sheets). This enables us to understand the transition of the sample portfolio from 2019 to 2020. The blog series looks at:
- Probability of Default (PD) estimates: What transition did we see in the default likelihood of our sample portfolio from year-end 2019 to year-end 2020?
- Loss Given Default (LGD) estimates: What is the severity of LGD that we can expect investors (and lenders) to sustain from their investments against corporates in our sample?
- Expected Loss (EL) estimates: What is the EL across regions and sectors sampled in our study?
Calcuating PDs
The sample is based on 7,186 entities, the details of which are explained further in “Portfolio Composition” below that provides regional, industry, and revenue-based breakdowns. Credit Analytics’[1] Probability of Default Fundamentals (PDFN) can generate credit scores for companies of all types, including rated and unrated, public and private companies, globally.[2] PDFN incorporates both financial and business risks to generate an overall PD value. This innovative approach captures important credit risk drivers in a statistical PD model, and provides users with a well-rounded measure of credit risk, where different sources of risks can be easily identified. In “Estimating 2020 Financials” below, we explain a spreading methodology that we deployed to generate estimates of 2020 financials when these were not published by an entity.
The PD for our sample population of corporates (i.e., the possibility that an entity will default on its contractual financial obligations), increased from an average of 9.7% when calculated using the 2019 year-end financials (2019PD) to an average of 12.7% when calculated against the 2020 financials (2020PD). In Figure 1 below, we display the distribution of the sample study’s credit profiles according to credit scores that represent the PD of an entity (note: the further you move to the right on the X-axis, the higher the PD). Two important characteristics can be observed: 1) The credit landscape of our sample is largely skewed towards the lower end of the scoring spectrum (i.e., less attractive credit scores), indicating a generally high credit risk for these entities, and 2) There is a noticeable negative transition between 2019PD and 2020PD, implying that the COVID-19 pandemic further weakened the credit profiles. Entities with weaker credit scores are more susceptible to adverse business, financial, and economic conditions, and could migrate to even weaker credit scores, or perhaps even default on their obligations, should conditions not improve or worsen. In the context of emerging markets, weaker credit scores represent an even more important issue, as a result of local economies being unable to control monetary policies that are tied with that of the U.S., a higher refinancing risk, and higher cost of funds.
In any economic crisis, some entities are more prone to default than others. In addition, some countries, regions, industries, and sectors might perform better or worse than others. Looking at our data, as revealed below in figure 2 we see that amongst 10 Global Industry Classification Standard (GICS) sectors, Consumer Discretionary shows the highest 2020PD average of 15%, followed by Energy with an average 2020PD of 14%. Remarkably, the Energy 2019PD was 7.5% and, therefore, our model finds that the pandemic doubled the likelihood that an entity operating in this sector would default. This is economically salient as the pandemic was followed by a severe drop in energy commodity prices leading to a substantial haircut in the revenue of entities operating in the sector. On the other hand, we see Utilities with the lowest average 2020PD of 7.2%, followed by Consumer Staples with an average 2020PD of 9.9%, confirming the general view of these sectors being defensive.
In Figure 3 below, we see Indian-based corporates and Gulf Cooperation Council (GCC)-based corporates occupying different ends of the PD spectrum based on 2020PDs. Indian-based corporates also had the highest 2019PD, indicating that the ranking we see in Figure 3 is not just because of the COVID-19 environment, but is also a reflection of a fundamental profile that dates back to pre-pandemic times.
Portfolio Composition
As shown in Figure 4 below, the sample portfolio consists of 7,186 non-financial corporates split across GICS sectors and regions. We also show the revenue breakdown, with the majority of companies falling in the small-size cluster of revenues below USD10 million.
Figure 4: Portfolio composition
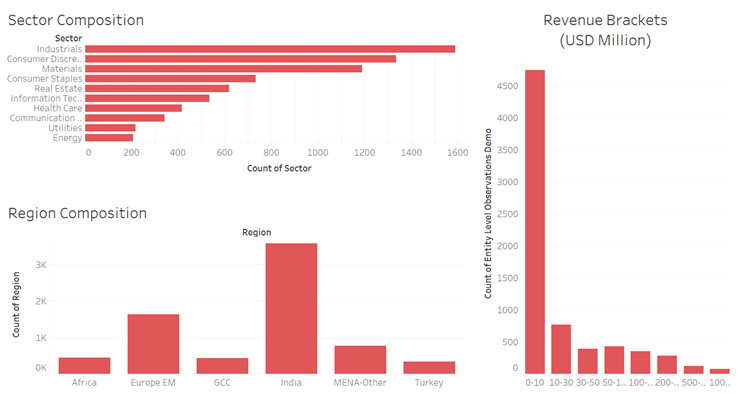
Source: S&P Global Market Intelligence Credit Analytics PDFN, as of 31 March 2021. For illustrative purposes only.
Estimating 2020 Financials
A number of entities in our sample study had not published their financial statements at the time of preparing the data underlying this blog. We looked at S&P Capital IQ’s consensus data from equity analysts to project the financial figures of such entities for the year 2020. We first identified top-line growth projections (i.e., what equity analysts are forecasting revenues to be for the year 2020) for those entities in our sample that are covered by equity analysts. Top-line growth projections were then aggregated on a GICS sector basis based on average figures. As an example, we see in Figure 5 below that Energy entities were projected to see their revenues decline by close to 17% while communication services services were projected to grow by 9%.. We used these sector averages to predict top-line growth for each entity with missing 2020 financials, and then extrapolated the missing financials using a forecast model.
Click here for more information about PDFN.
[1]An S&P Global Market Intelligence solution suite, Credit Analytics blends cutting-edge models with robust data to help users reliably assess the credit risk of rated and unrated, public and private companies across the globe.
[2] S&P Global Ratings does not contribute to or participate in the creation of credit scores generated by S&P Global Market Intelligence. Lowercase nomenclature is used to differentiate S&P Global Market Intelligence PD credit model scores from the credit ratings issued by S&P Global Ratings.
Learn more about Market Intelligence
Request DemoCorporate Credit Risk Trends in Developing Markets: A Probability of Default Perspective
Click here to read the second blog in this series