
This article provides a deep-dive analysis on the credit risk impact of the European Oil and Gas industry which takes into account the consequences of the COVID-19 pandemic, causing oil prices to plummet on oversupply and weakened demand. The analysis covers European public companies in the Oil and Gas sector between January 2, 2020 and April 16, 2020 and utilises S&P Global Market Intelligence’s Probability of Default Model Market Signals (PDMS) which captures equity market sentiment, providing signs of potential default for 71,000+ public companies[1].
The oil price war between Saudi Arabia and Russia came to an end on April 13, 2020 and the Organization of the Petroleum Exporting Countries (OPEC+) amongst other oil producing nations agreed to collectively cut production. The initial fall out and subsequent trigger for a decline in oil prices came in early March when Saudi Arabia and Russia could not agree on production cuts given the reduced demand from China. A series of key events from January 2020 until the middle of April 2020, provided early warning signals of a deterioration in credit risk which can be seen via PDMS.
Table 1: Key Oil and Gas Industry Events and Median PDMS Scores for Europe
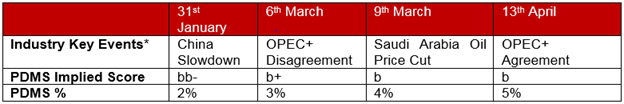
*Please note we did not list all the key events but the ones we have selected for the purpose of this article
Source: Probability of Default Model Market Signals, S&P Global Market Intelligence, April 13, 2020. For illustrative purposes only.
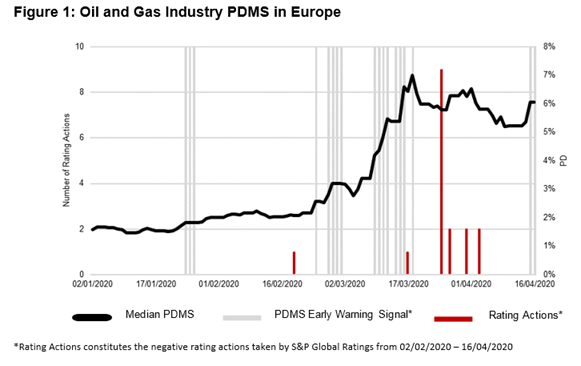
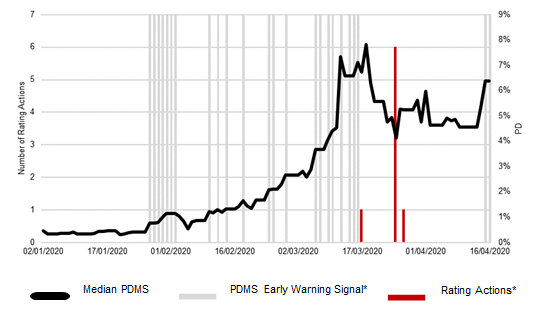
*PDMS Early Warning Signal represents the PDMS flag when the PD increases more than 30% over a 5 day period.
Source: Probability of Default Model Market Signals, S&P Global Market Intelligence, April 16, 2020. For illustrative purposes only.
News of weakening oil imports and a subsequent global economic slowdown began to surface which raised concerns in the oil markets towards the end of January 2020 (See Table 1). This event was captured by the PDMS early warning signal on January 24, 2020 and further PDMS early warning signals were observed over the course of March and April. These early warning signals mirror key industry events such as OPEC+ breakdown, Saudi Arabia cutting its crude prices, and the eventual OPEC+ agreement. Figure 1 shows the combined PDMS (%) for the Oil and Gas industry in Europe, PDMS early warning signals. The PDMS early warning signal unit is normalized in respect to the number of rating actions (e.g. if the maximum number of observed rating actions per day is 10 then the PDMS early warning signal value in the same period will have a signal equal to 10 plus one). The early warning signs from PDMS were also observed on February 24 2020 and March 9 2020 ahead of the OPEC+ disagreement on supply cuts on March 6 2020, and Saudi Arabia cutting its crude prices three days later on March 9, 2020. Post the OPEC+ production cuts on April 13, 2020, the PDMS model indicated that the market is not fully satisfied with the outcome, flagging further early warning signals on the April 16, 2020.
Figure 2: Oil and Gas Exploration and Production PDMS in Europe
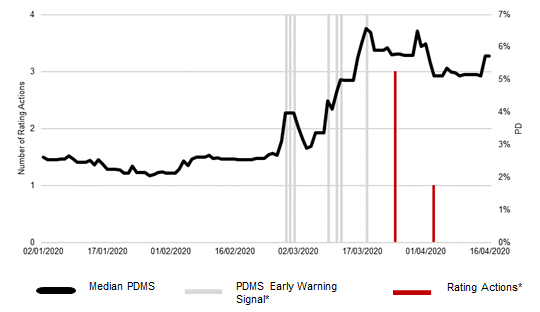
*PDMS Early Warning Signal represents the PDMS flag when the PD increases more than 50% over a 5 day period.
Source: Probability of Default Model Market Signals, S&P Global Market Intelligence, April 16, 2020. For illustrative purposes only.
The Oil and Gas Exploration and Production sub industry in Europe showcased early warning signals of a deterioration in credit risk on February 28, 2020, March 09, 2020 and March 18, 2020. From a global perspective, the US Oil and Gas Exploration and Production sub industry has seen a higher intensity of early warning signals.
Figure 3: Oil and Gas Equipment and Services PDMS in Europe
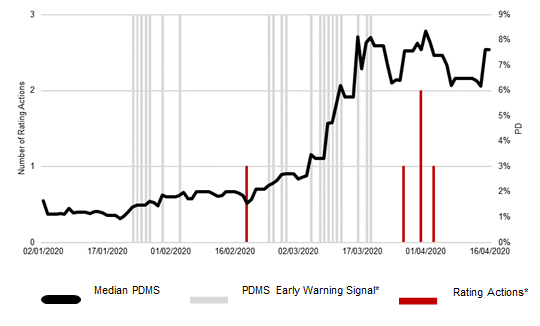
*PDMS Early Warning Signal represents the PDMS flag when the PD increases more than 50% over a 5 day period.
Source: Probability of Default Model Market Signals, S&P Global Market Intelligence, April 16, 2020. For illustrative purposes only.
The Oil and Gas Equipment and Services sub industry indicated early warning signal on the January 23 2020 (See Table 1). Then on the February 24, 2020, March 05, 2020 and March 16, 2020 which early warning indicators were observed. Further signals were flagged throughout March.
Figure 4: Integrated Oil and Gas PDMS in Europe
*PDMS Early Warning Signal represents the PDMS flag when the PD increases more than 75% over a 5 day period.
Source: Probability of Default Model Market Signals, S&P Global Market Intelligence, April 16, 2020. For illustrative purposes only.
The Integrated Oil and Gas sub industry saw a number of early warning signals coinciding with key events that unfolded in the oil industry from late January such as the slowdown in China’s demand, OPEC+ disagreement and Saudi Arabia cutting crude prices in early March. The latter continued to impact the industry throughout the month.
In summary, the PDMS remains elevated considerably above January 2020 values, with recent early warning signals highlighted via PDMS indicating continuous fragility. The current challenges in the Oil and Gas industry have highlighted the importance of having mechanisms in place in order to monitor credit risk from an individual company perspective, as well as providing a macro view for different countries and industries via benchmarks. It forms part of our Credit Analytics offering which provides analytical tools and solutions for scenario analysis and stress testing. The additional Credit Analytics models include:
- PD Model Fundamentals that looks at financial risk and business risk to measure the likelihood of default for 860,000+ public and private banks, corporations, and Oil and Gas firms over one- to five-year time horizons.[2]
- CreditModelTM is a credit scoring model trained against S&P Global Ratings to produce credit score for 73,000+ larger corporates and financial institutions.[3]
The PDMS model is a sophisticated tool that allows effective proactive credit risk monitoring. It forms part of our Credit Analytics product offering which provides analytical tools and solutions for scenario and stress testing. Read our complimentary piece on ‘Stress Testing Energy Companies in the Current Environment’.
For more information on how Credit Analytics can help, please contact us here.