
It is just over one year since the UK government’s ‘mini-budget’ which rocked financial markets and later contributed to the downfall of the Liz Truss Conservative government. As 10-year gilt yields surged, in response to unfunded tax cuts, Liability Driven Investment (LDI) schemes were forced to make collateral calls, selling government bonds to generate cash, in turn driving yields higher. The Bank of England intervened to stabilise the UK gilt market. One year later, leverage is once again in the spotlight, with the Bank of International Settlements and US Fed expressing concern about leverage in the US government bond market (Treasury basis trades).
Interestingly, we can use S&P Capital IQ pension data to identify many of the companies using LDI schemes, as the use of repurchase agreements (one of the techniques used to manage interest rate risk) leads to a – somewhat unusual - negative entry in the pension plan asset breakdown. Repurchase agreements allow the schemes to leverage their exposure to certain asset classes, usually fixed income, by using existing holdings as collateral. The chart below highlights some of those companies with the largest repurchase agreements, both absolute and in relation to their plan assets. Inspection of the report and accounts confirms that all of the companies below are using repurchase agreements and/or LDI schemes.
Chart 1: Example UK FTSE 350 companies potentially using repurchase agreements and LDI schemes
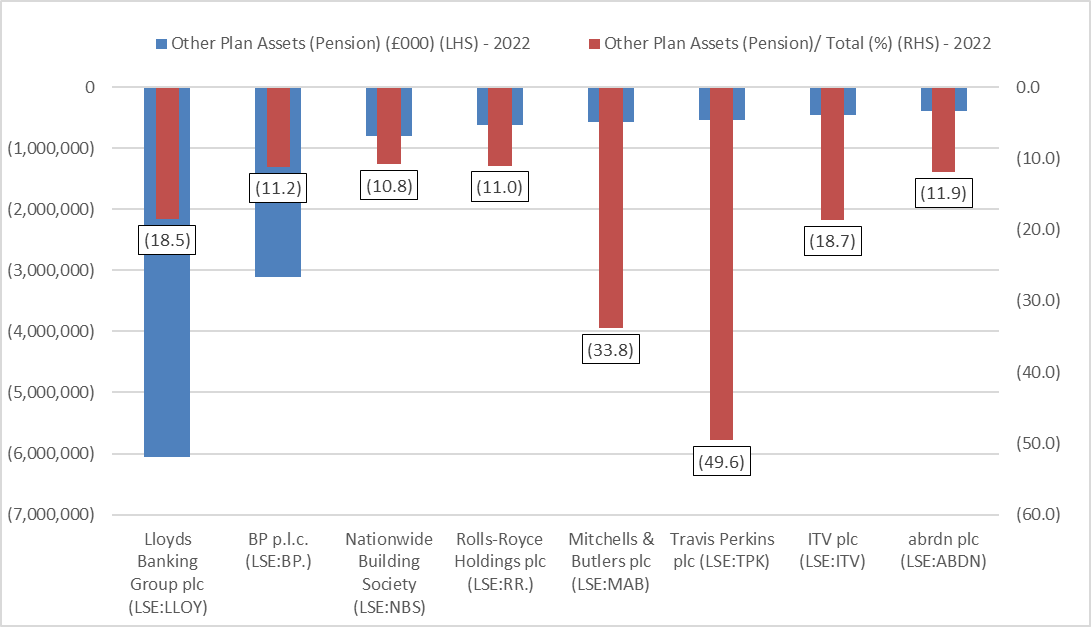
Source: S&P Capital IQ Pro pension data
Travis Perkins stands out for its high levels of repurchase agreements (leverage) in relation to its plan assets. Below in Exhibit 1 we can see from BP’s annual report the use of repurchase agreements to ‘fund liability driven investments’. The Capital IQ Pro platform picks up this in the ‘Other Plan Assets’ field. LDI schemes can also be noticed with very high percentage allocations to fixed income, in particular when above 100%: this reflects the use of borrowed funds (repos or repurchase agreements) to invest in additional fixed income.
Exhibit 1: BP’s pension details both on Capital IQ Pro (Upper) and the Annual Report (Lower)
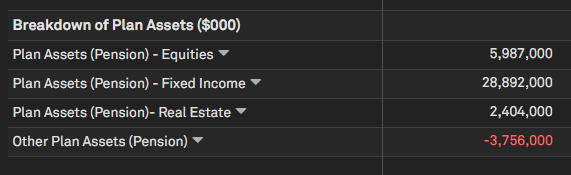
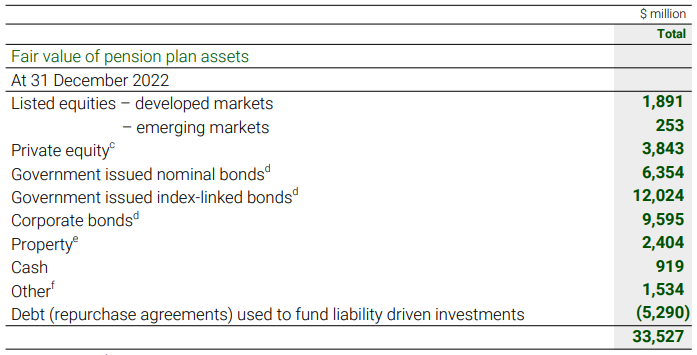
Source: S&P Capital IQ Pro platform and company reports
LDI schemes are somewhat contentious. Although the use of derivatives and leverage can both magnify returns and help manage interest rate risk (mostly from an accounting volatility perspective), returns on fixed income portfolios have still been low in the past 10-15 years. Critics argue that in order to meet their obligations companies should either simply pay more into their schemes or invest in ‘higher risk’ asset classes such as equities. The short-term volatility of liquid equities, they argue, is not of concern in meeting long-term obligations. Similarly, there has been an increasing allocation to private equity and other asset classes such as infrastructure. Currently these asset classes attract a high ‘capital charge’ under the Solvency regulatory regime, but regulators and politicians have discussed reducing these to both provide investment into the UK and help pension schemes and insurers meet longer-term liabilities.
More generally, interest rate rises are a positive for the insurance sector, which is major provider of pension products. Depending on the accounting system used, they can decrease the value of their liabilities. More intuitively, they increase the return the insurance company makes on its portfolio of fixed-income investments. The short-term impact can be negative – as interest rates and bond prices are negatively correlated – but over time as the portfolio is replaced returns increase.
Chart 2: Example Solvency levels and sensitivities to interest rate moves
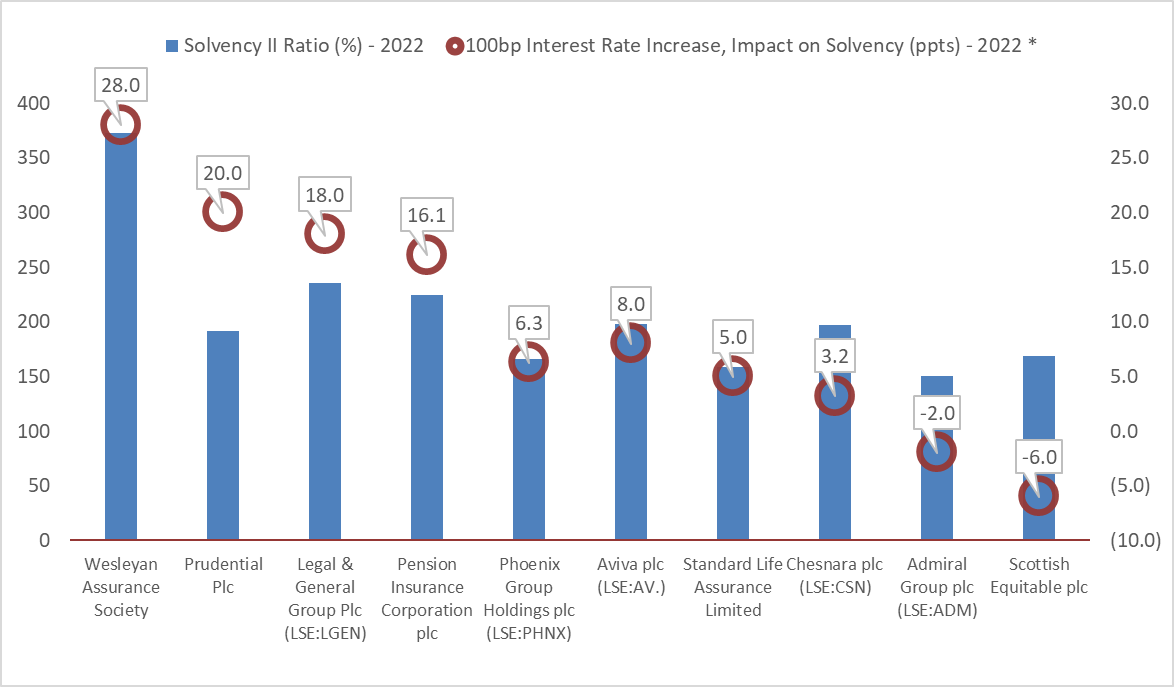
* Note in some cases we have extrapolated from a disclosed sensitivity of below 100bps (eg 80bps) to 100bps. The true sensitivity may be non-linear and slightly different.
Source: S&P Capital IQ Pro, SFCR
The Solvency II system measures insurance companies’ capital strength, much as Basel does for the banking system. Chart 2 above shows the Solvency position for a selection of UK insurance companies, and its sensitivity to changes in interest rates. S&P Capital IQ collect this sensitivity data, and others - including equities, real estate and so on – where available. The greater the solvency ratio the greater the ability of the company to withstand losses. For the majority of companies, the impact in ppts of an increase in rates is positive. All of those posting the greatest benefit from higher rates are predominantly Life insurance companies. Legal & General, for example, is also one of the biggest players in both the bulk purchase annuity market and LDI schemes. Admiral Group is focused on non-life insurance, principally car insurance, and posts a small decrease.
The effects are similar for corporate pension schemes themselves, and we are starting to see the impact of higher rates on the schemes. Typically – and despite the use of LDI techniques - the duration of the liabilities is higher than the duration of the fixed income assets (partially) backing them, and hence the impact of higher rates improves the overall Net Asset Value (NAV) of the schemes. In turn, this improves the prospects of companies to transfer their schemes to properly capitalised and regulated insurance companies. After all, it makes sense for company management to be focusing on their core strengths – for example retail, chemicals, or aerospace – and not on the investment and actuarial challenges of managing a large pension fund. From Chart 2, we can note that many of the large UK Life insurance players – eg Aviva, L&G – are well capitalised to take on new schemes.
Earlier in the year, BP (which features in Chart 1 and Exhibit 1), was in the news as it explored various options to transfer its pension liabilities to a consortium of insurance companies. With c.£30bln of plan obligations, this would have been one of the largest of such deals in history.
In the chart below we have aggregated the available FTSE 350 pensions data on the S&P Capital IQ Pro platform to chart the movements in surplus/deficit of corporate pension schemes. We calculate this as the difference between the DBO (Defined Benefit Obligation) and the Plan Assets. Due to a duration mismatch, most schemes have seen their liabilities decrease by more than their assets. These assets will have been affected by interest rate rises, but only partially as they also contain equities and other asset classes.
Chart 3: FTSE 350 estimated aggregated pension surplus/deficit and UK Govt 10-year yields
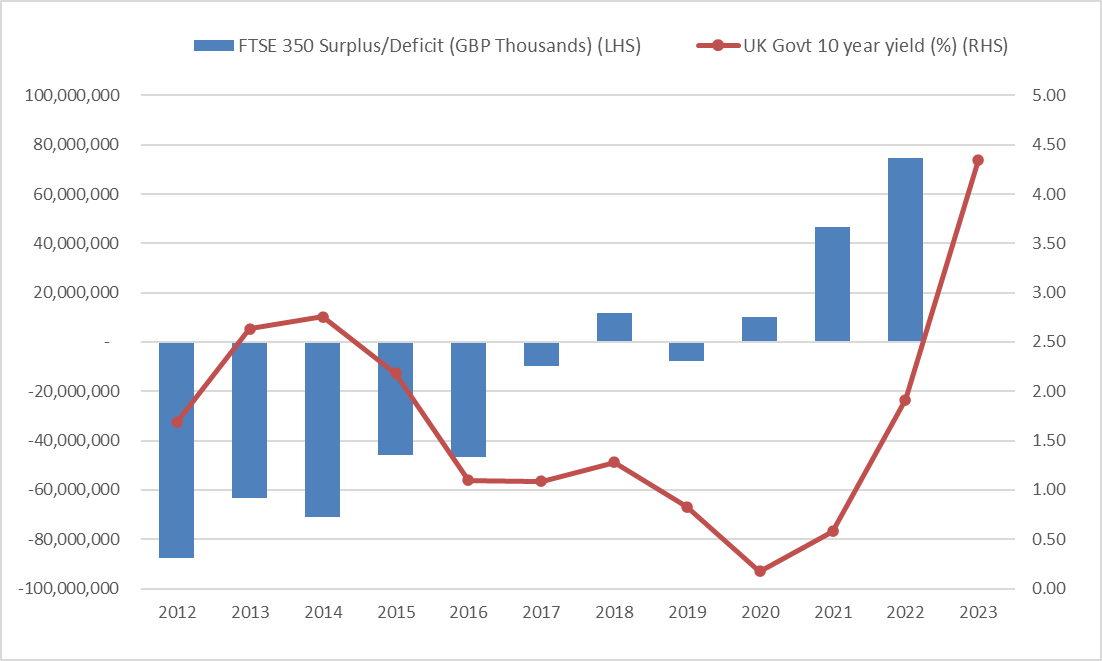
Source: S&P Capital IQ Pro
We can see a clear link between the rate rises since 2020 and the surplus. Looking further back, the relationship is less clear, though there are many other factors to consider: life expectancy, company contributions, hedging, equity returns and so on.
If you would like to explore our differentiated insurance data in more detail, please get in touch for a demo of the platform from one of our Industry Product Specialists. In addition to the Solvency data discussed above, we collect SFCR filings for c.1800 European insurance companies. In the US we collect the Statutory NAIC dataset, which is large and highly granular, and can be used to explore catastrophe exposure, auto underwriting, capital and more. For all regions, we collect detailed sector-specific data (IFRS and US GAAP): all backed up by our Data Quality Programme. We have started collecting IFRS 17 data. Lastly, our dedicated sector-focused News Team regularly explores insurance issues like above in detail.