
Credit ratings are issued by S&P Global Ratings, which is analytically and editorially independent S&P Global Market Intelligence and from any other analytical group at S&P Global. S&P Global Ratings does not contribute to or participate in the creation of credit scores generated by S&P Global Market Intelligence. Lowercase nomenclature is used to differentiate S&P Global Market Intelligence credit model scores from the credit ratings issued S&P Global Ratings.
Download the full report
DownloadSummary
Factor-based investing techniques have become popular among equity investors, due to their potential to generate higher risk-adjusted-returns.[1] Stock portfolio selection usually requires a trade-off between performance and risk and can be influenced by multiple investment preferences (e.g., focus on companies with high environmental, social and governance scores) and constraints (e.g., liquidity, time-horizon, tax, etc.). In our latest research, we employ a classical long-only passive investment strategy over the span of the past six years, and we identify factors that can generate a potential alpha signal, from the underlying components of S&P Global Ratings’ Corporate issuer credit ratings (ICRs): Business Risk (BR) and Financial Risk (FR).
This is a follow-up analysis to our Financial and Business Risks: What Underlying Factors Tell Us About The Relative Strength Of Issuers With Similar Credit Ratings, where we showed that BR and FR scores are important drivers of the odds of a rating change over a certain time horizon. Our empirical analysis suggests that having a low FR is not sufficient to attain a lower odd of a downgrade. Indeed, BR plays a critical role in driving higher odds of an upgrade rather than a downgrade.
In this case study we show how we leveraged the BR and FR scores to construct a portfolio with higher risk-adjusted returns than the S&P 500 Index.[2] By constructing a portfolio of companies with appropriate combinations of (BR, FR) with higher historically observed frequency of rating upgrades, our analysis shows that the Sharpe ratio and active returns of the portfolio outperform the benchmark, during the historical period.
Portfolio Construction
To construct our portfolio, we looked at the difference between upgrade and downgrade odds, as rating changes are often accompanied by significant stock price reactions.[3]
We selected the BB rating category (including BB+, BB and BB- rated companies) since the market reacts strongly to upward changes in credit rating from speculative grade (SG) to investment grade.[4] This choice enables investors to potentially access higher returns due to the intrinsically higher credit risk level of speculative grade companies.
Table 1, extracted from our previous research, reports the historically observed difference between upgrade and downgrade odds of companies rated in the BB category, for each combination of underlying BR and FR factors. The cells are highlighted in green (red) when the odds of an upgrade over a 1-year time horizon are significantly higher (lower) than the odds of a downgrade over the same time horizon. We select companies in the green cells and red cells to construct two separate stock portfolios and use the S&P 500 Index as a benchmark portfolio.[5]
Table 1: ICR Upgrade minus downgrade frequency for BB rating category in 1-year horizon
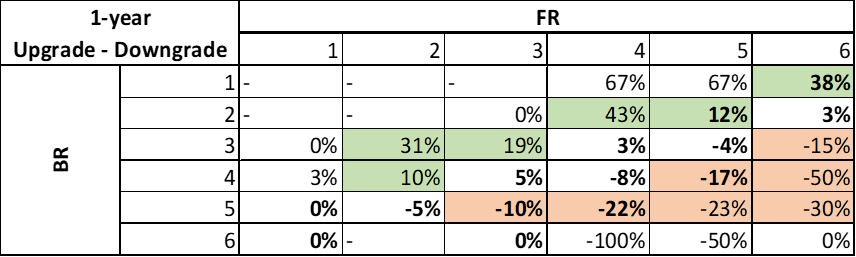
Source: S&P Global Market Intelligence. Data as of June 5, 2021. For illustrative purposes only.
Our Findings
In this analysis, we use a passive, market-weighted and long-only investment strategy, where the period of investment is assumed to be 1-year long without rebalancing.[6] We set the initial stock portfolio as of January 1, 2015 and examine its performance by the end of 2015, when all positions are closed. In each subsequent year, we repeat the process, selecting a new stock portfolio at the beginning of the year based on the same criteria described above, and closing all positions by the end of the year. We leverage S&P Global Market Intelligence’s Portfolio Analytics (PA) platform for this analysis.[7] The performance of the green and red portfolio is shown in Table 2.a and Table 2.b respectively. To gauge the portfolio performance, we use the risk-adjusted return measures like Jensens Alpha (or Alpha Measure), Active Return and Sharpe Ratio (SR), and include the S&P500 as an absolute benchmark.
Table 2.a: Green Portfolio – Low BR and Low-Mid FR
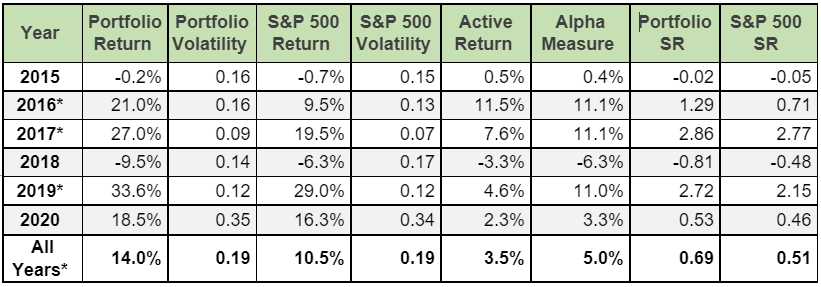
Source: S&P Global Market Intelligence. Data as of June 5, 2021. For illustrative purposes only. * Statistically significant at 1% level
Table 2.b: Red Portfolio High BR and High FR
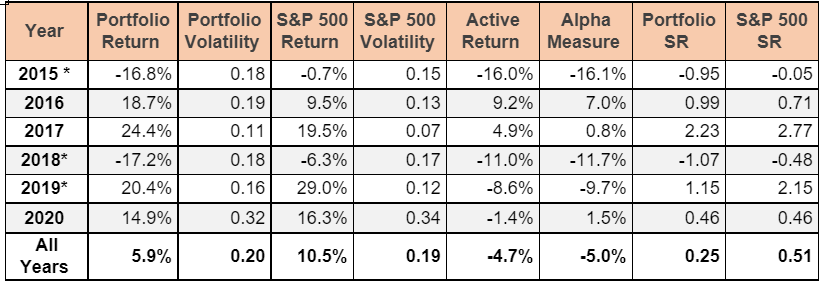
Source: S&P Global Market Intelligence. Data as of June 5, 2021. For illustrative purposes only. * Statistically significant at 1% level
Jensen’s Alpha or Alpha Measure is the difference between actual returns of the portfolio and those that could have been earned on a benchmark portfolio with the same amount of market risk. A higher positive value indicates better performance of the portfolio compared to the expectations while a negative value indicates that the portfolio performed poorly than expected. As shown in the Table 2.a, the alpha measure of the green portfolio is positive for the overall time horizon, with exception of 2018 where it is negative.[8] In Table 2.b, we observe the alpha measure of the red portfolio is mostly negative indicating that the red portfolio returns are worse than the market.[9]
Sharpe Ratio (SR) is a measure of risk-adjusted return; it provides a comparison against the benchmark. SR gives an idea regarding whether one should invest in a particular portfolio as compared to benchmark or similar assets in the same category. The overall SR of the green portfolio is higher than the benchmark SR, indicating risk-adjusted return of green portfolio is higher. Conversely, we see the SR of red portfolio is lower than benchmark S&P 500’s SR.
In this analysis, we use the underlying components of the ICR, namely BR and FR scores, to construct alpha signals for a stock’s portfolio, in the period 2014-2021. We observe the following:
- Green portfolio: Companies (BR, FR) combinations historically associated to higher frequency of ICR upgrades:
- Portfolio outperforms the benchmark for the historical timeframe considered with portfolio beta being less than 1.
- Except for 2018, we observe positive active returns and higher SR than the benchmark SR.
- Red portfolio: Companies (BR, FR) combinations historically associated to higher frequency of ICR downgrades:
- Underperforms the benchmark and more volatile with portfolio beta above 1.
- This can act as an early warning indicator to monitor companies, that may see deterioration, from an existing portfolio.
Conclusion
Factor selection is the cornerstone of quantitative strategies, enabling construction of stock portfolios with high risk-adjusted returns. Using the BR and FR scores underlying S&P Global Ratings Corporate criteria could help build portfolios which tend to outperform the market. Our analysis on a long-only passive strategy without rebalancing constitutes a useful reference for stock selection of speculative grade companies or can be incorporated within multi-factor strategies.
BR and FR factors could also be used as an active tool for monitoring portfolios’ performance, by removing stocks whose companies move from green to red cells, and hence such funds can be put on scrutiny or removed. In the fixed-income space, where we can deploy the BR & FR factors to identify opportunities in high yielding bonds and debt instruments.
Learn more about BR and FR scores, and gain transparency into the scores underlying issuer credit ratings, with RatingsXpress®: Scores & Factors dataset.
RatingsXpress: Scores & Factors
Learn MoreSources
1 N. Amenc, R. Deguest, F. Goltz, L. Martellini, E. Shirbini, A. Lodh, Chp.17 - Designing Multi-Factor Equity Portfolios, Risk-Based and Factor Investing, Elsevier, 2015, Pages 377-399, ISBN 9781785480089, https://doi.org/10.1016/B978-1-78548-008-9.50017-4
2 Our analysis does not represent investment advice and shall not be construed to provide forward-looking views on future performance of any of the portfolios mentioned here.
3 Even-Tov, O., Ozel, N.B. “What moves stock prices around credit rating changes?” Rev Account Stud (2021). https://doi.org/10.1007/s11142-020-09573-6
4 Reddy, Dr & Bosman, Rudi & Mirza, Nawazish. (2019). “Impact of Credit Ratings on Stock Returns.” Buletin Ekonomi Moneter dan Perbankan. Vol. 21., No. 3, pp.343-366. DOI: 10.21098/bemp.v21i3.986.
5 The market-cap of green portfolio is around 24 Billion USD with average count of 40 stocks; and market-cap of red portfolio is around 5 Billion USD with average count of 130 stocks.
6 In our passive strategy, we do not rebalance the portfolio within a year. In other words, companies that move from a green to a red cell within a given year (due to a rating action that changes the underlying FR and BR combination) do not get removed from the static portfolio defined at the beginning of that year. Also, the transactional cost for creating the portfolio at the beginning of the year is assumed to be Nil.
7 All adjustments related to stock’s cash dividend, stock split, rights offering, etc. are considered in calculation of the total returns by the PA tool.
8 The green portfolio underperformed the benchmark in 2018, due to political events; indeed, the portfolio contains many stocks linked to SG firms that are more susceptible to pronounced downtrends at such times. However, the green portfolio achieved lower volatility (beta less than 1) than the benchmark.
9 Interestingly, we find similar results for a stock portfolio constructed using only companies in the BBB rating category (i.e. BBB+, BBB and BBB-), but the alpha is lower than in the BB case, consistent with the idea that lower risk commands lower rewards.