
Despite the global pandemic, the U.S. utility-scale solar generating capacity grew by 4,238 MW in Q4'20, capping a year of steady additions amounting to 10,023 MW. This is an increase of 77.8% in capacity additions from 2019. U.S. now has 49,124 MW of installed utility-scale solar capacity.
Meanwhile, the wind industry added 7,248 MW in the quarter and 13,829 MW of capacity in 2020, an increase of 48% from 2019.
Get essential insights into S&P Global Market Intelligence quarterly review of the U.S. solar and wind power sector:
- Solar and wind capacity by the quarter
- Largest completed solar and wind power plant projects in Q4'20
- Planned projects by development status
- Largest owners of planned solar and wind projects in the quarter
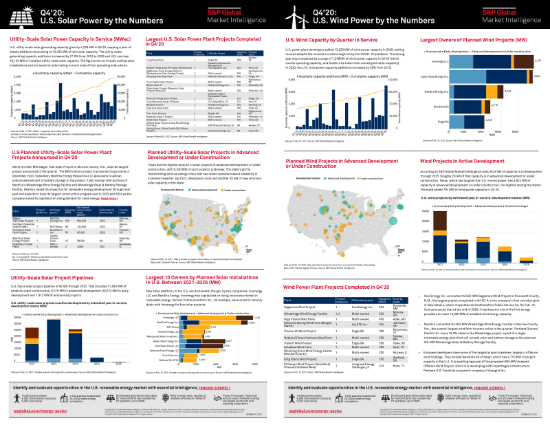
Source:S&P Global Market Intelligence. Images for display purposes only.