
This paper builds on our previous analysis on the transshipment of Western-made components to Russia to further establish trade dependencies between different markets with Russia and deliver a case study on shipment data relating to Turkey. The common high-priority items (CHPIs) list will be mapped to reported statistical/customs data, as well as the bill of lading data, for a statistical analysis.
- Trade data reported by Russia prior to its invasion of Ukraine shows a ramp-up in import of critical items for military equipment, with trade value up 21% in 2021 compared with 2020, accounting for 4.3% of Russia's total imports during that year. Mirror trade in 2022 sharply declined 38%, accounting for 3.5% of total imports, followed by a 10% increase in 2023.
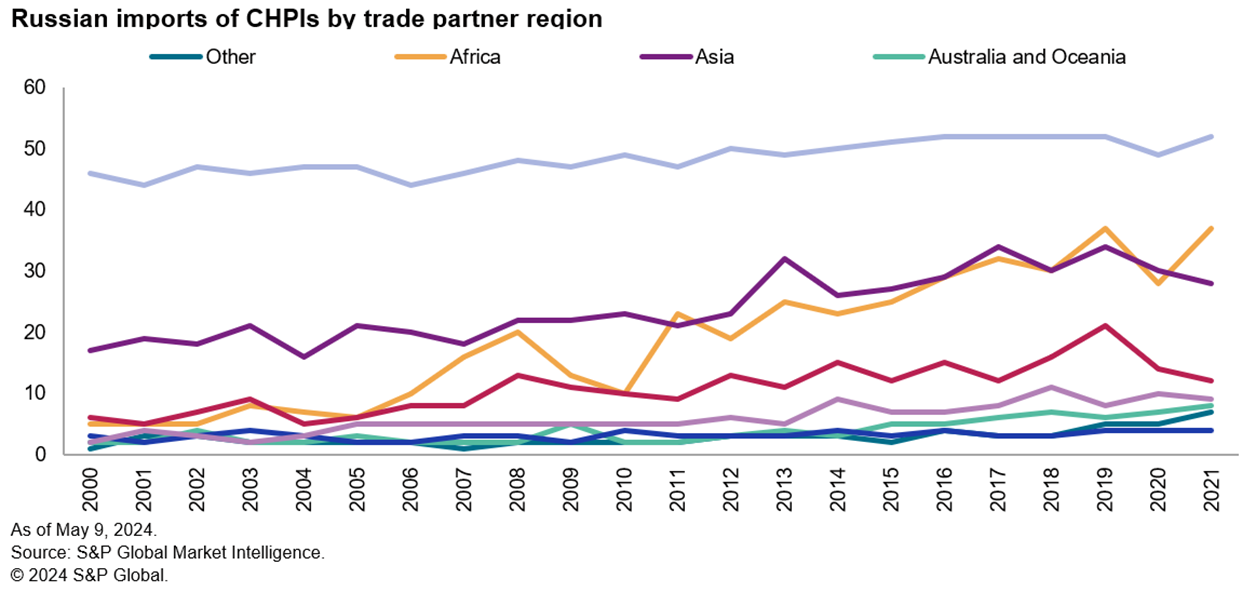
- Russia's imports partners have steadily increased since 2000: 82 in 2000, 112 in 2010 and 147 in 2020.
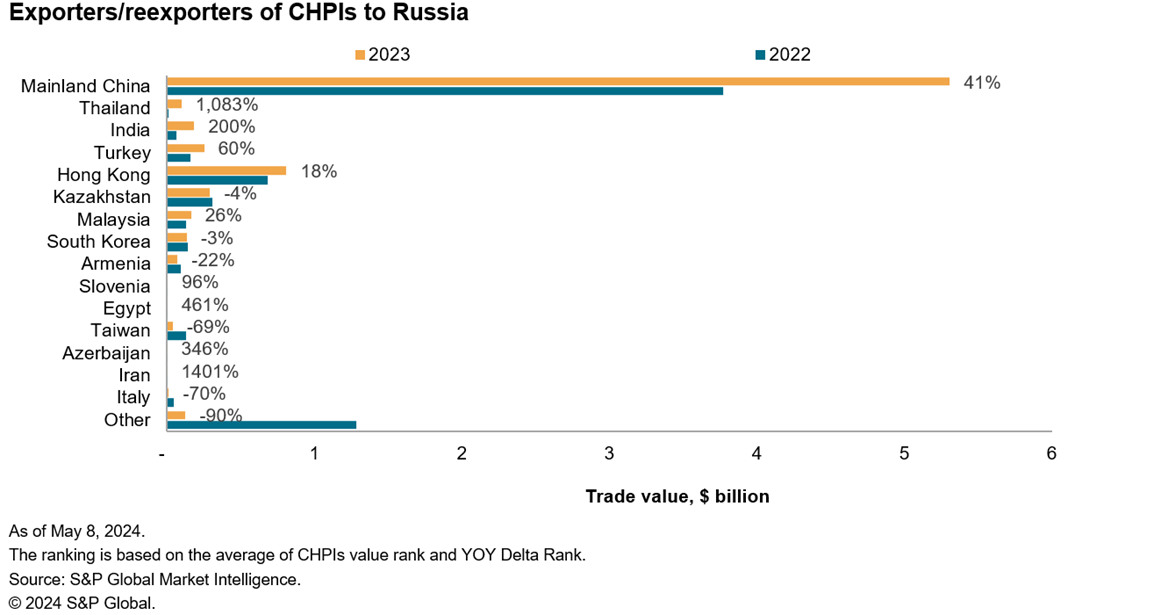
- Dependence on mainland China and Hong Kong has continued to grow; trade with mainland China increased 41% during 2022, while trade with Hong Kong increased 18% during the same period.
- The three markets that were engaged in considerable export/reexport activity to Russia were Thailand (up 1,083%), India (up 200%) and Turkey (up 60%), whereas Kazakhstan's export/reexport to Russia dipped 4%. These six markets — mainland China, Hong Kong, Thailand, India, Turkey and Kazakhstan — accounted for 66% of reported CHPIs export/reexport to Russia in 2023, but now account for 92%.
- During fourth quarter 2022 and much of 2023, Turkey's reported shipments of goods that matched the CHPI list to Russia increased, with shipments 314% higher in 2023 compared with 2022.
- Shipments to Russia originating from Turkey accounted for 71% of CHPIs exports in 2022, but decreased in market share to 50% in 2023, with the remaining 50% showing as having origins other than Turkey. Analyzing the origins further showed that 33% originated from EU member states (Germany accounting for 15%), 1% from the UK and 16% from other origins.
- A total of 725 unique shipper companies were identified as shipping goods associated to CHPIs, up 52% increase compared with 2022, whereas on the consignee side, 765 unique companies were identified in 2023 as shipping goods associated to CHPIs, up 190% compared with 2022.
- Air freight registered a significant increase of 263% between 2022 and 2023. This modality, which only accounted for 6% in 2021, increased to 19% in 2022 and 29% in 2023, with more than 88% showing the "port" of lading as Istanbul New Airport.
Analysis
Evolution
Although statistical trade data has not been released by the Federal Customs Service of Russia since the start of the war (last series to be published was January 2022), mirror trade can be used to gain an idea of Russia trade dependency in the last two years.
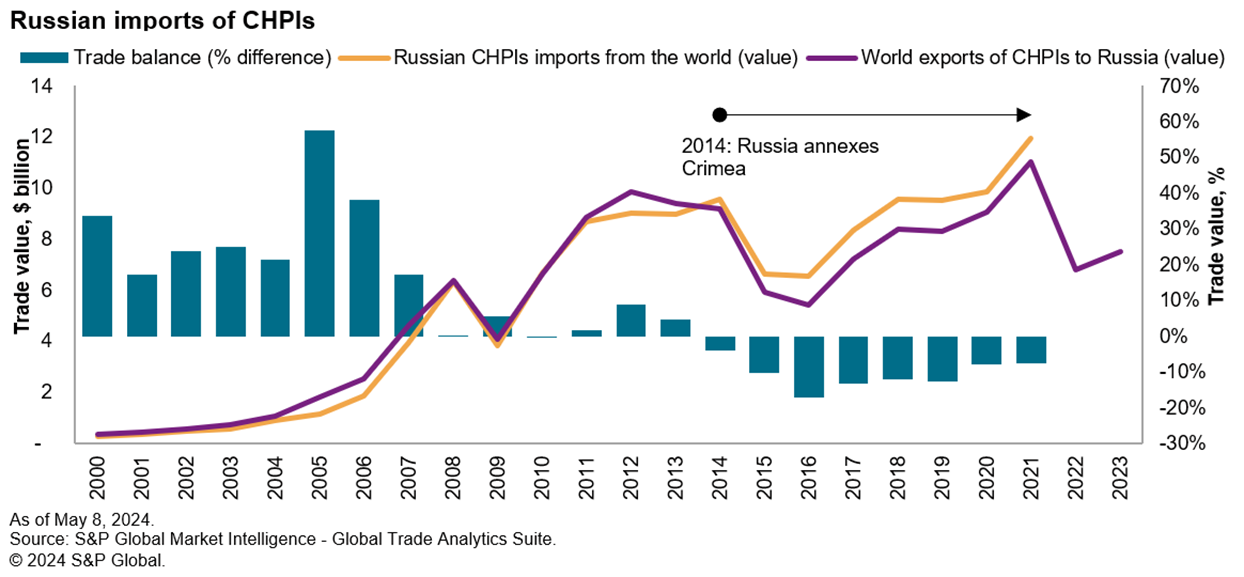
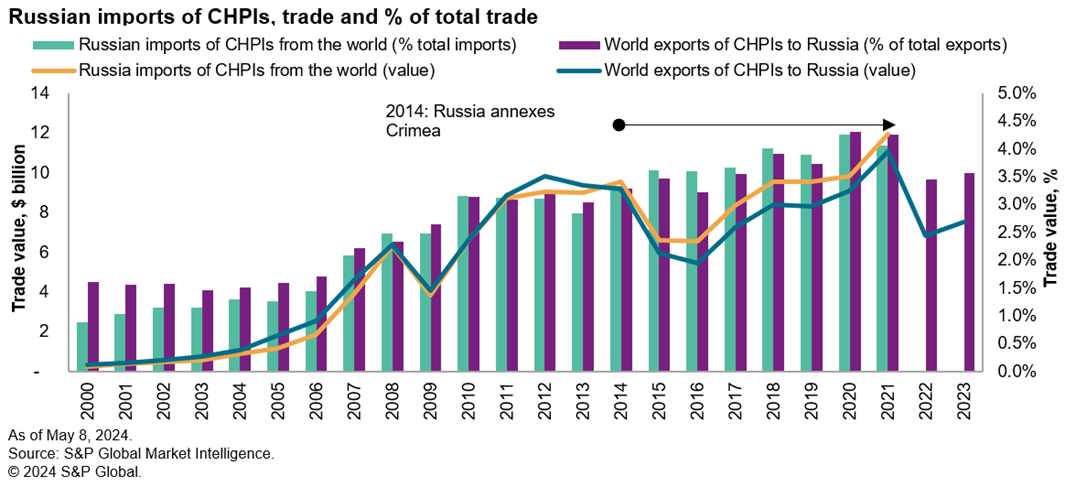
Trade of CHPIs has increased considerably over the years, often with visible ramp-up periods prior to periods of military conflict, such as prior to the annexation of Crimea in 2014 and subsequently in the years leading up to the invasion of Ukraine in 2022.
Comparing imports to exports show that these are fairly in line in terms of trade balance. Data up until 2014 show exports declarations of CHPIs being marginally similar in terms of growth/decline, as well as some visible differences in terms of import/export trade balance, with Russian import figures showing a surplus in contrast to the deficit of reported available export/reexport data to Russia.
The share of CHPIs in contrast to total trade also fundamentally changed over the years, up 8% year over year between 2000 and 2021, while exports/reexports to Russia grew 5% year over year, with year-over-year evolution also appearing to go through 3-4-year cycles of growth and decline, visible on both reported trade and mirror trade.
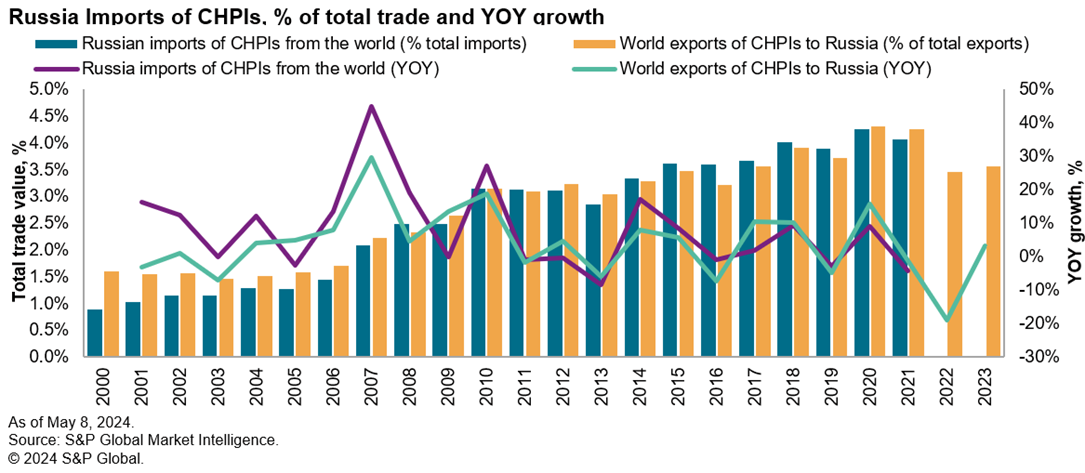
Reviewing the available periods prior to the war showed the ramp-up in import of critical items for military equipment, with trade value up 21% in 2021 compared with 2020 and accounted for 4.3% of total trade imported by Russia during that year. Meanwhile, mirror trade for 2022 sharply declined 38% and accounted for 3.5% of total imports, followed by a slight increase of 10% in 2023.
Dependency and origin
Having established that there has been considerable growth activity in CHPIs in recent years, it is interesting to see how the number of partners contrasts in comparison to this evolution. Imports data since 2000 shows a steady increase in the number of partners that Russia is sourcing from — 82 in 2000, 112 in 2010 and 147 in 2020. This diversification in imports shows shifts from dependencies in Europe to those in Asia. In 2000, 73% of imports of CHPIs originated from Europe and 12% from Asia, but in 2020, 68% of imports came from Asia and 26% from Europe in 2020.
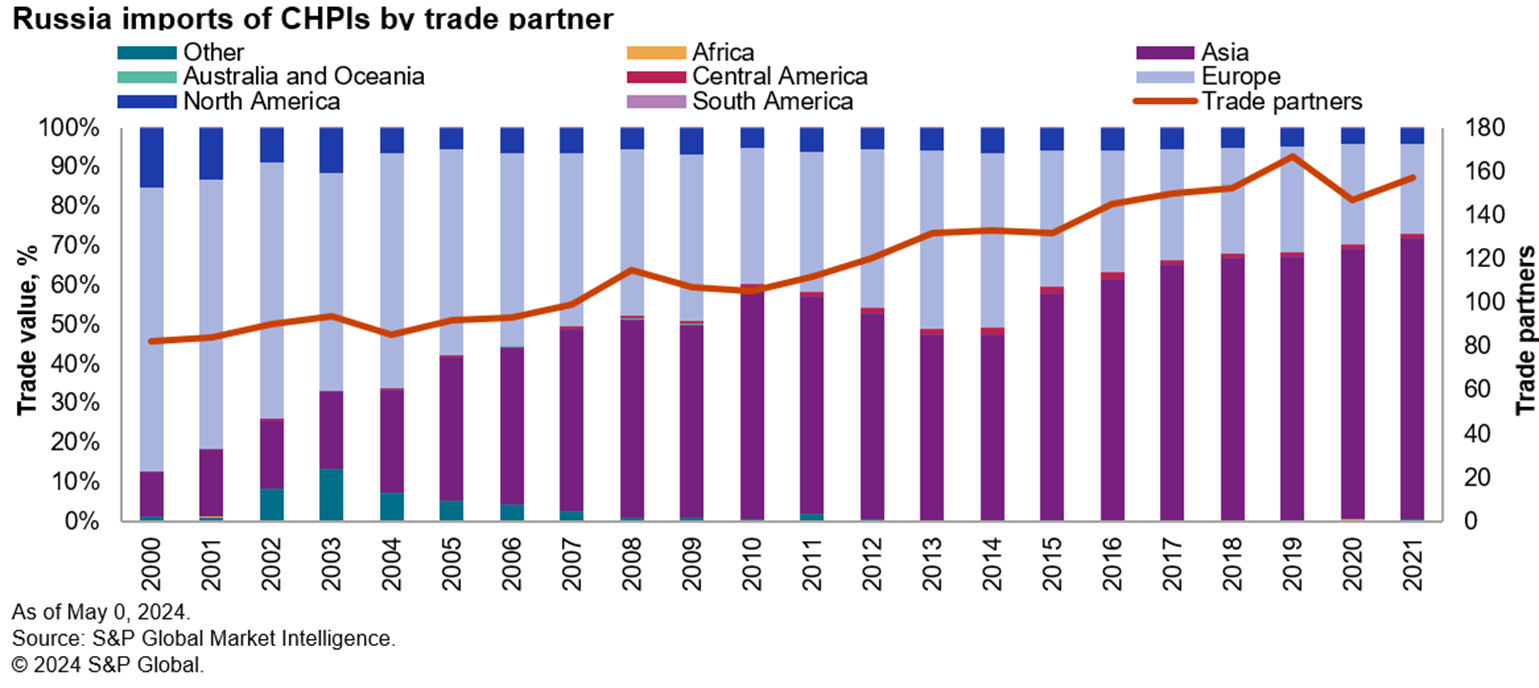
This 91% increase (as shown in the figure above) in unique trade partners during the 20-year period show that the majority of the growth stem from Asia, Africa and Central America. Although some of these partners only represent smaller percentages in the market share, this shows evolution in trade outside of "traditional" partners. Imports from Africa, for instance, which only accounted for 0.01 and five partners in 2000, have grown considerably to account for 0.22% and 37 partners in 2021.
Through mirror reporting, we can better establish some of the trade activities undertaken in the last two years with Russia, highlighting the continuing dependence on mainland China and Hong Kong; trade with mainland China increased 41% during 2022, while trade with Hong Kong was up 18% during the same period. When ranked by year-over-year growth and market share, the three markets that showed considerable export/reexport activity to Russia were Thailand (up 1,083%), India (up 200% and Turkey (up 60%), whereas Kazakhstan's export/reexport to Russia dipped 4%. These six markets accounted for 66% of reported CHPIs export/reexport to Russia in 2023, but now account for 92%.
Click here to download the full complimentary paper where we provide:
- Fundamentals toward trade data declarations
- The continuation of above analysis on export and reexport of common high-priority items (CHPIs) to Russia
- Case study on Turkey
Subscribe to our complimentary Global Risk & Maritime quarterly newsletter for the latest insight and opinion on trends shaping the compliance and shipping industry from trusted experts.
Download the full paper:
Click hereMaritime State of Play Report: Evolution of deceptive shipping practices — Voyage irregularities
Read More