
Introduction:
Post the previous blog In Search of Resilience Part 1 - A Data-Driven Scoreboard published in February 2023, we highlighted several measures which could flag sectors are showing an increase in default risks from macroeconomic volatility. In the follow up In Search of Resilience Part 2 Banking Sector Sidebar we flagged that a number of sectors are highly leveraged relative to cash flows and could be more impacted by a combination of rate hikes and macroeconomic slowdown.
In this article, we outline a simple process to identify early warnings on credit risk deterioration at the industry/sector level; and examine their impact on a portfolio of entities and securities:
- Early warning on industry-wide credit risk changes using Creditpro and RiskGauge®
- Confirm early warnings via RatingsXpress Scores and Factors and S&P Global Ratings’ research
- Estimate impact on portfolio of entities using RiskGauge®
- Assess impact of widening of credit spreads and perform VaR estimation on the portfolio using Financial Risk Analytics
We illustrate this four-step process using an example on slowdown in consumption on the retail and commercial real estate sectors.
- Industry Early Warning
Both industry-wide S&P Global Ratings’ upgrades and downgrades via Creditpro® (Chart 1: Step 1a); and industry benchmarks using RiskGauge® from Credit Analytics (Step 1b) indicate a similar picture of credit risk deterioration for both sectors.
RiskGauge® is a statistical model that uses an optimized combination of socioeconomic inputs, and firm-level market and fundamental indicators to generate a probability of default (PD) and a credit score for all public and private companies, also unrated, globally. The benchmarks are obtained by aggregating RiskGauge® credit assessment for all companies operating in the same industry sector. Using a 1 year forward-looking PD (higher being weaker); a letter score, expressed on same scale as S&P Global Ratings’ issuer credit ratings (ICR) from aaa to d, but expressed in lowercase nomenclature to distinguish from an actual S&P Global Rating’s ICR; or a numeric score from 1 to 100. We display the benchmark for the lowest 25-ile as the weakest entities tend to trend up in defaults first, similar results found using the median benchmark (see chart 2 on Step 1b).
Chart 1: Step 1a: Early warning on industry-wide S&P Global Ratings’ upgrades vs. downgrades
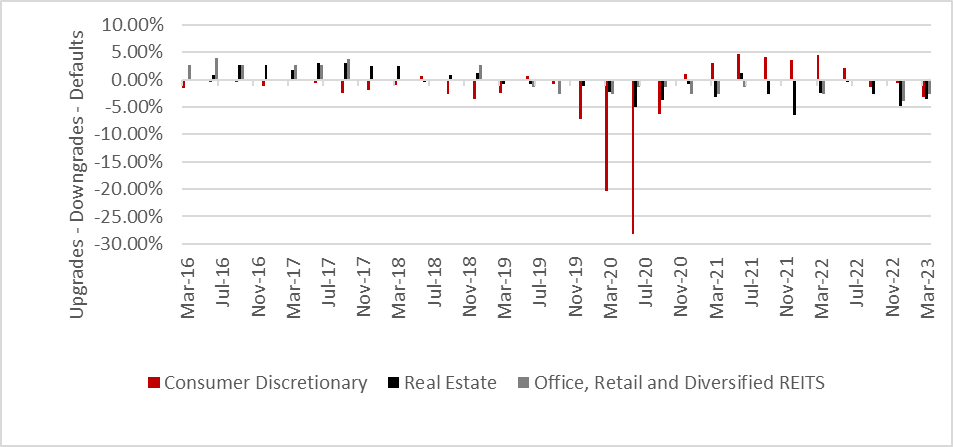
Source: Upgrades and downgrades data from Creditpro® on RatingsXpress. For Illustration Only. As of May 2023
Table 1: Observations from credit ratings downgrades in consumer discretionary sector and real estate
|
Consumer Discretionary sector |
Real estate, including Office, Retail and Diversified REITS |
|
Downgrade momentum started around year 2018 (on the back of retail slowdown with bankruptcies of Sears Holdings and downgrades for Bed Bath and Beyond etc.) and acceleration in 2020, during COVID-related lockdowns temporary recovery post-covid in 2021. Trends started reversing negatively starting Q2 2022 post Ukraine-war and rate hikes to stem inflation |
Decline had started since late 2017, and continued (deteriorate) throughout the period; with downgrades outweighing upgrades going into end Q2 2023 |
Chart 2: Step 1b: Early warning on industry level market indicators using RiskGauge® (rated and unrated companies) using RiskGauge Industry Benchmarks. We used the Bottom industry quartile as illustration
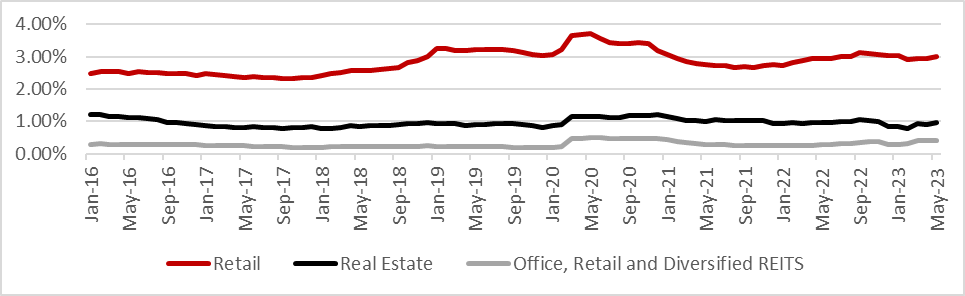
Source: The S&P Global RiskGauge Model benchmarks in S&P Global Market Intelligence. For Illustration Only. As of June 2023
Table 2: Observations from trends in RiskGauge benchmarks for retail and real estate sectors
|
Retail |
Real estate |
|
PD started to trend upwards starting 2018 and peaked in 2020 during Covid. There was a brief recovery in 2021, but trends again worsened starting 2022Q2 |
Default risk remained stable – but mirroring the trends on retail with a lag. It worsened in year 2020 during Covid period, recovered in 2021 and now showing a pick-up in year 2023 |
- Seek confirmation of early warning indicators from credit risk fundamentals
The RatingsXpress®: Scores & Factors dataset provides transparency into how S&P Global Ratings analysts establish an Issuer Credit Rating. By assessing the underlying business, financial, industry, and economic risk factors and assessments, plus the stand-alone credit profile, which drove an analyst's rating recommendation for an issuer. Whilst the S&P Global Ratings’ rated universe mostly cover larger bond issuers, the trends on the underlying credit risk drivers (e.g. business risk, real estate pricing, leverage vs. earnings trends) – if broadly applicable to the sector – may also be applicable to the unrated universe.
- As an illustration, we look at the % of entities with the weakest cash flow to leverage (5 = aggressive and 6 = highly leveraged) scores
- We can clearly see the number of entities with very weak cash flows vs. debt (interest) payments is worsening starting the second half of 2022 (Chart 3)
- Business risk profile remain high for consumer discretionary; with all three sectors worsening starting 2022Q4. (Chart 4)
- Consumer industry with > 30% of entities with the weakest 5 or 6 in business and financial risks indicates a significant negative “skew” in credit risks
Chart 3: Percentage of entities with S&P Global Ratings’ Cash Flow to Leverage Scores of 5 or 6 (one year moving average) of the consumer discretionary and real estate sectors
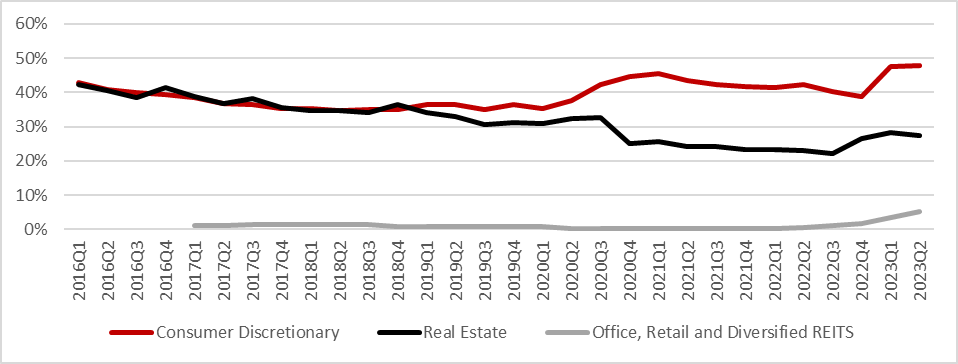
Source: S&P Global Ratings’ Scores and Factors are available on RatingsXpress. As of June 2023. For Illustration Only.
Chart 3: Percentage of entities with S&P Global Ratings’ Business Risk Profile Scores of 5 or 6 (one year moving average) of the consumer discretionary and real estate sectors
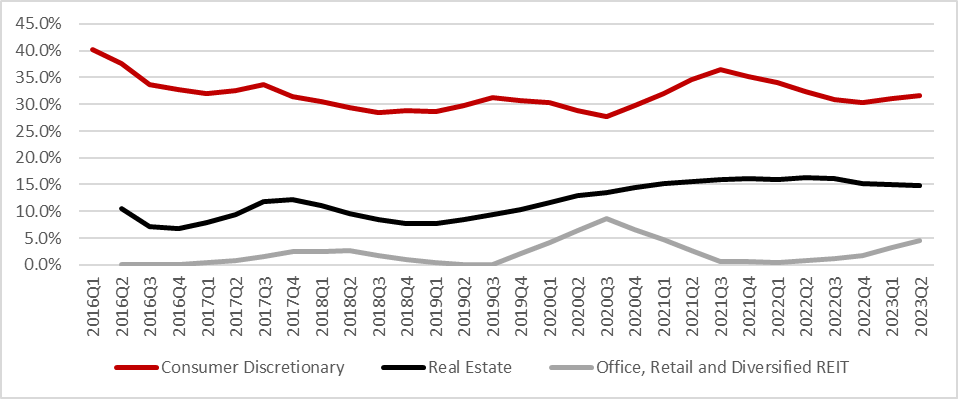
Source: S&P Global Ratings’ Scores and Factors are available on RatingsXpress. As of June 2023. For Illustration Only.
Step 2b: Contrast early warning signals with S&P Global Ratings Research
- S&P Global Ratings research serves as a confirmation on such trends
- Review at some of the key industry level publications, such as Outlook, Industry Top Trends etc. (see Chart 5 as illustration)
Chart 5: Snapshot of RatingsDirect Hot Topics page, which displays key industry level and thematic commentaries published by S&P Global Ratings
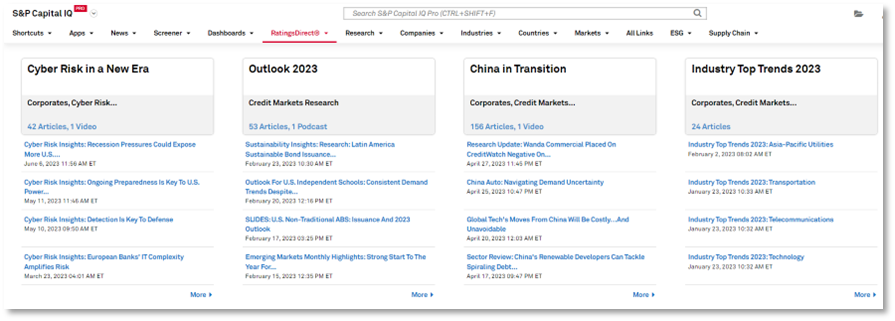
Source: S&P Ratings Hot Topics page on RatingsDirect® on CIQ Pro. As of June 2023. For Illustration Only.
- We note a potential to use Natural Language Processing on specific sections of entity level articles within that industry (e.g. Credit Highlights, Outlook etc.) to automate the review process and save time, rather than reading tens of research papers. This will be explored in a follow up publication.
Step 3: Estimate the impact of potential fundamentals shocks on credit risk of your portfolio
For illustration purposes, we created an equal weighted portfolio of entities within the consumer discretionary industry which are rated by S&P Global Ratings – hence likely to have traded derivatives and CDS.
Calculate a hypothetical scenario RiskGauge Scores: in this example we apply the following simplifying assumptions:
- Total Revenue, EBIT, EBITDA, EBT, Cash from Ops and Operating Income and Net Income declined by 10%
- Interest expense rose by 2x
The distribution of RiskGauge credit scores (in lowercase) and the industry breakdown (base case) in the charts below. There is a noticeable deterioration in RiskGauge scores under this scenario, with 23.5% scoring at “b+ and below” (see Chart 6)
Chart 6: Distribution of RiskGauge scores from a sample of companies in the consumer discretionary sector – comparing the base-case in the pre-scored universe vs. hypothetical scenario with macroeconomic slowdown and interest rate hikes
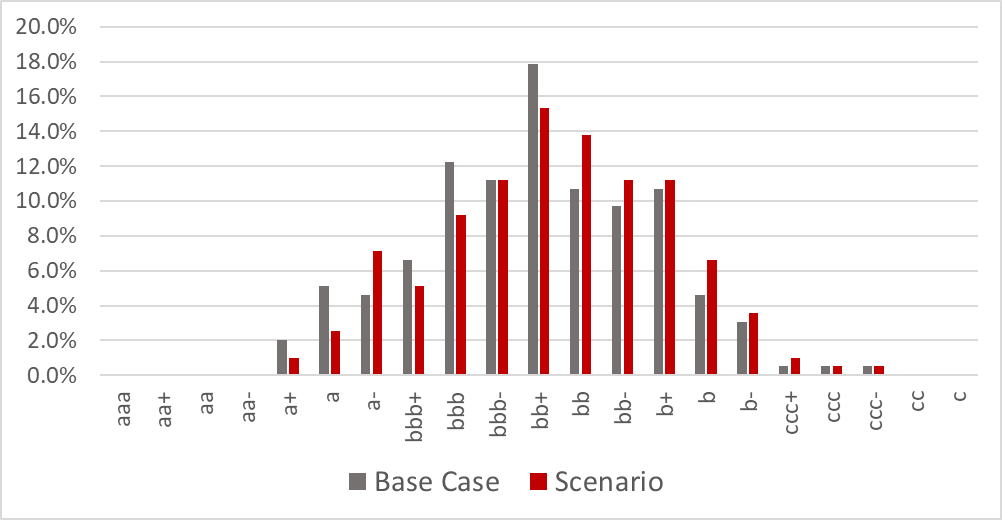
Source: The S&P Global RiskGauge Model in S&P Global Market Intelligence. For Illustration Only. As of June 2023
Within the consumer discretionary sector however, there is a significant variation of credit risks among sub-industries– not all are likely to be equally vulnerable to macroeconomic slowdowns. In our base case, we see that the generally larger automobile manufacturers have a median score of “bbb-“ globally, as compared to apparel retail with a median of “bb-“ (see Chart 7). Each segment within the rings maps to a credit score (legend on the right); which one can drilldown into the industry (Apparel Retail indicated below in Chart 8 as an illustration)
Chart 7: Sample of Median RiskGauge Scores in the Base Case, by Industry
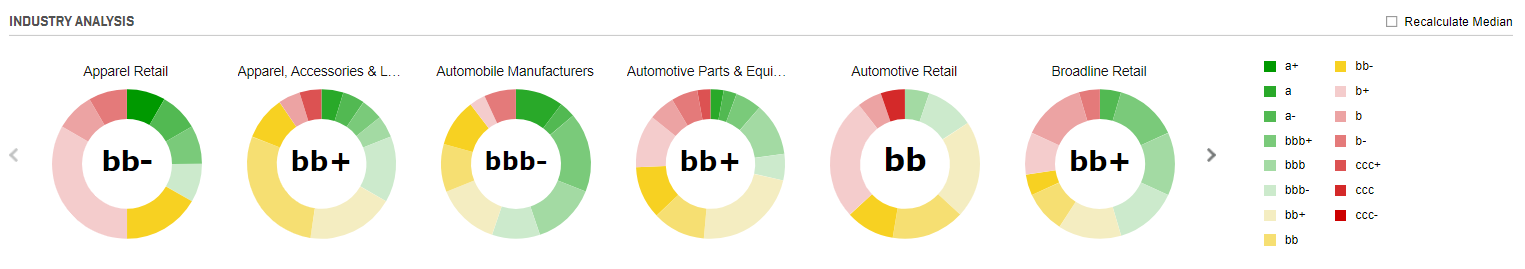
Source: Credit Risk Dashboard which is part of the Credit Analytics product within S&P Global Market Intelligence. For Illustration Only. As of June 2023
Chart 8: Distribution of RiskGauge Scores from a sample of companies in the Apparel Retail Industry
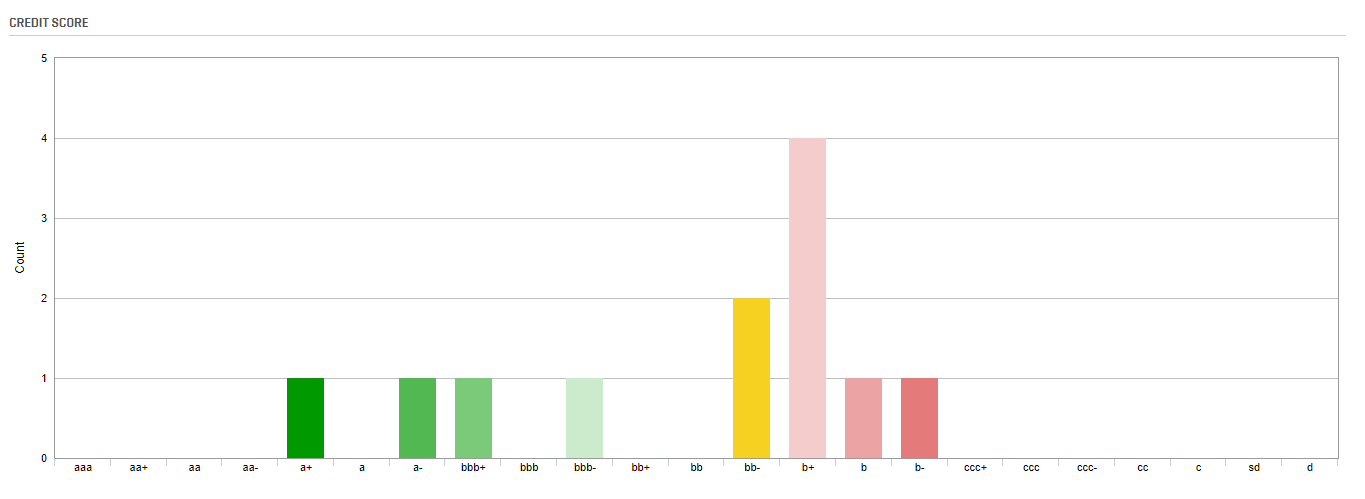
Source: Credit Risk Dashboard which is part of the Credit Analytics product within S&P Global Market Intelligence. For Illustration Only. As of June 2023
Step 4: Estimate Market Risk and Counterparty Credit Risk from market volatility and credit spread widening
Many of our market participants do not have exposures directly to the entities as borrowers but are exposed to credit risk via fixed income or derivative securities in their traded portfolios (see Chart 9). Risk analytics can be performed on cloud or run as a service to:
- Estimate market risk
- Estimate investment credit risks (e.g. on corporate bonds, asset backed pools etc.) from a scenario of credit spread widening from issuers in real estate and consumer sectors
- Calculate Value at Risk at the portfolio level
- Estimate Expected Shortfall for tail end-risks under FRTB
- Estimate counterparty credit risk
- As an additional step, estimate the impact on Counterparty Credit Risk and the credit valuation adjustment (CVA) of derivative portfolios
Chart 9: An illustration of S&P Global’s Traded Market Risk solution offered by Financial Risk Analytics
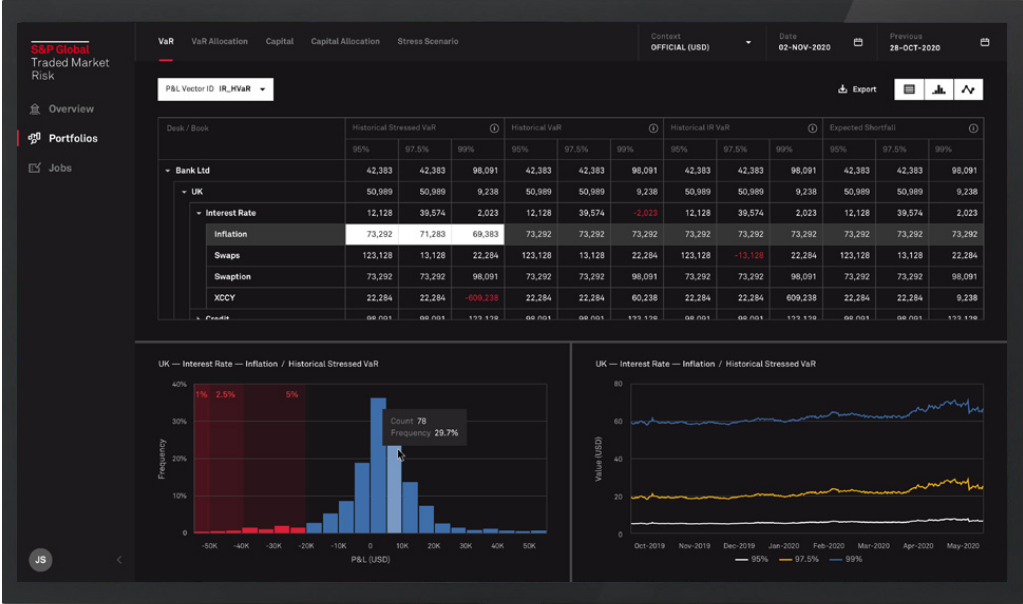
Source: Financial Risk Analytics, from S&P Global Market Intelligence. As of June 2023. For illustration Only