
The U.S. solar market added 1,968 MW of utility-scale solar power capacity in Q2, a reduction of 31% from Q1. In the first half of 2021, 4,804 MW of solar power went online. This was an increase of 15.1% from the year-ago period and nearly halfway to the 10-GW total from all of 2020.
In the wind market, developers connected 2,819 MW worth of wind power capacity to U.S. grids, a 19% jump from the same period in 2020. Meanwhile, a record 1,979 MW of wind power capacity was retired in the same quarter, demonstrating a sign of the industry's maturity as wind fleets age.
Get essential insights into our quarterly review of the U.S. solar and wind power sector:
- Solar and wind capacity by the quarter
- Largest completed solar and wind power plant projects
- Planned projects by development status
- Largest owners of planned solar and wind projects in the quarter
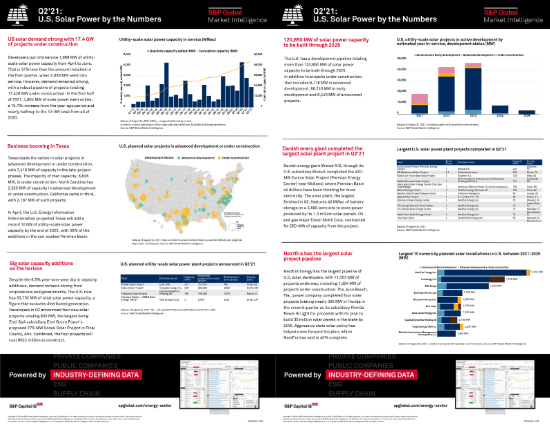
Source:S&P Global Market Intelligence. Images for display purposes only.