
Uncertainty in the market is unavoidable, but for every trade decision where capital is at risk, making sure you have confirmation from multiple measurements that conditions are right gives you the highest probability of success.
Indicator Overload is Challenging
Traders are all too familiar with information overload, not only from external market news but often of their own making. They may fill their price charts with numerous lines and indicators to make, confirm, or reconfirm trading decisions. Many are overwhelmed by the often redundant, occasionally contradictory, and ever-complicated battery of indicators as they consider whether to launch a new trade, add to a position, or objectively exit when a trend ends or reverses.
Much has been written on trend-following investment strategies and the persistent anomaly of momentum. Buying strength, buying breakouts, and momentum trading are all ways to describe this style. However, while appearing to be simple, emotions often force investors to cut winners too early, while averaging down losing trades.
A New Approach is Needed
Traders and investors need to take the guesswork out of making important decisions to streamline trend identification and momentum analysis. This calls for a solution that can help:
- Improve risk management by signaling when to exit trades to protect against loss of capital.
- Avoid analysis paralysis by eliminating confusing indicators on a chart that can stall decision-making.
- Provide transparency by delivering a complete view of technical conditions on any security/sector/index/asset over any timeframe.
- Simplify the complexity to gain clarity by blending trend, momentum, volume, and volatility for a comprehensive view of trends, while staying focused on price.
To address these needs, ChartIQ, now part of S&P Global Market Intelligence, and GoNoGo Charts have formed a partnership, which marks a significant advancement in data visualization and technical analysis.
Working Smarter to Navigate the Complexities of Financial Markets
This collaboration enhances ChartIQ's capabilities, offering users a comprehensive solution for insightful market analysis and decision-making. ChartIQ's advanced visualization and charting solution, known for being customizable and adaptable, enables users to explore complex datasets effortlessly. With support for seamless integration of third-party data sources ― including proprietary content, S&P Global data, and third-party data ― ChartIQ empowers users to uncover valuable insights and trends.
Integrating GoNoGo Charts' intuitive technical analysis tools into applications which leverage ChartIQ as a graphic solution provides users with access to a comprehensive suite of features designed to streamline trend identification, momentum analysis, and risk management. This partnership enhances our client’s applications by providing users with a holistic visual approach to data analysis and decision-making.
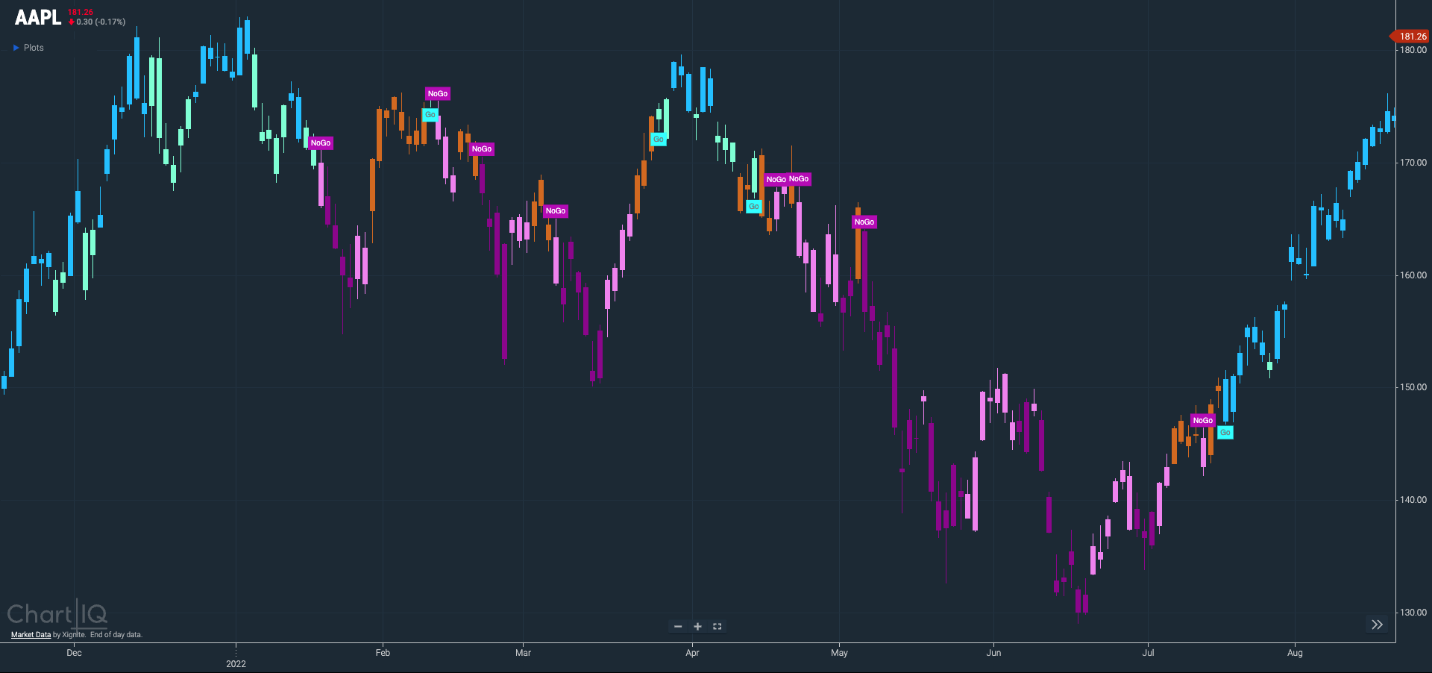
1. GoNoGo Trend®
Trend identification is arguably the most important concept in technical analysis. By blending objective, widely proven statistical indicators with the foundational principles of technical analysis, GoNoGo Trend colors the price action of any security according to the strength of its trend.
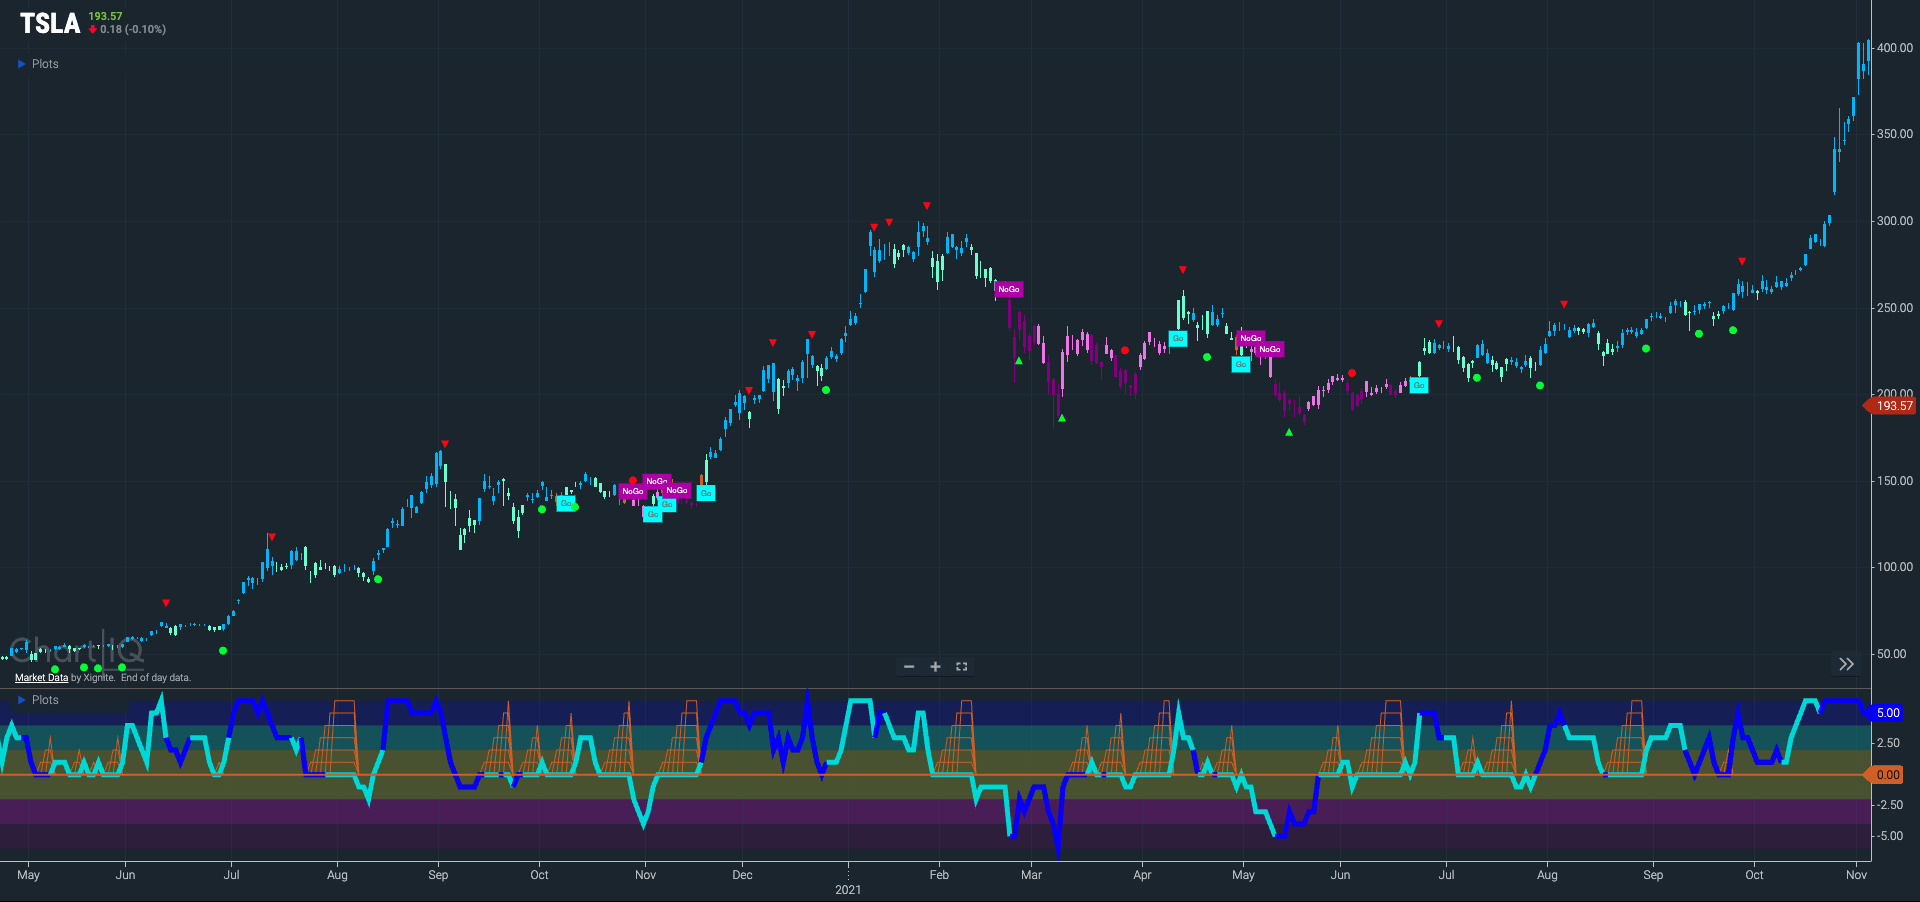
2. GoNoGo Oscillator®
Momentum goes hand in hand with trend identification, and GoNoGo Oscillator® helps investors understand the velocity of price change, giving valuable information about the strength of a trend and the market’s conviction in it.
3. GoNoGo Icons
GoNoGo Icons highlight low-risk opportunities for trend participation and alert investors to short-term counter-trend corrections with intuitive icons directly in the price action.
4. GoNoGo Squeeze®
Studies have shown that momentum readings are not only useful for mean-reversion strategies but can also add insight within trend. When inputs are in neutral territory, GoNoGo Oscillator rests at zero. Meaning, when enthusiasm wanes within a trending market, GoNoGo Oscillator provides an objective point of support/resistance for momentum at the zero line.
From identifying trading opportunities to managing risk and sharing insights, ChartIQ and GoNoGo represent a new standard in data visualization and technical analysis, delivering actionable insights and driving business success for users across the financial ecosystem.
A critical benefit of the GoNoGo Charts’ suite of tools is the clear exit and market reversal signals on the price chart itself. This feature is a powerful method to help clients reduce their market exposure and thereby preserve their trading capital.