
We are excited to provide additional detail on the release of new banking Industry Estimates metrics in Xpressfeed and the S&P Capital IQ Pro Desktop. With 7 new estimates recently released, we now offer 21 industry-specific metrics for the banking industry.
Each estimate metric has corresponding data points within the consensus level, such as high, lows, mean, median, standard deviation, number of estimates and actual values.
S&P Global clients can use industry-specific estimates to stay on top of industry trends, gauge market sentiment, and make accurate valuations of the overall analysis of a company.
Given the heightened level of scrutiny on banking conditions following liquidity pressure and multiple bank failures in the first half of 2023, detailed estimates will be an increasingly important tool for market participants to forecast performance and develop views on comparative positioning among banks.
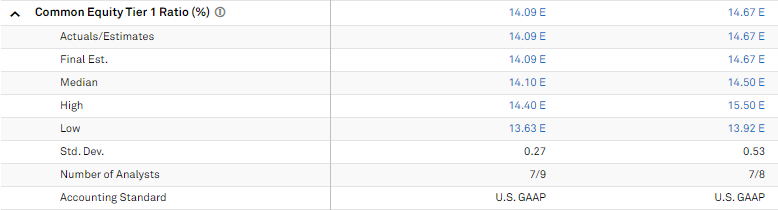
Using JP Morgan Chase & Co. (NYSE: JPM) as an example, we can now examine estimates for the firm’s Common Equity Tier 1 Ratio (CET1). CET1 is a key financial metric that measures a bank’s core capital strength and its ability to absorb losses. It is a critical component of regulatory capital requirements under Basel III and is closely monitored by regulators.
As shown below, JP Morgan’s CET1 ratio is expected to increase marginally from 14.09% to 14.67% in the coming year, displaying confidence in the bank’s current capital levels and ability to absorb losses.


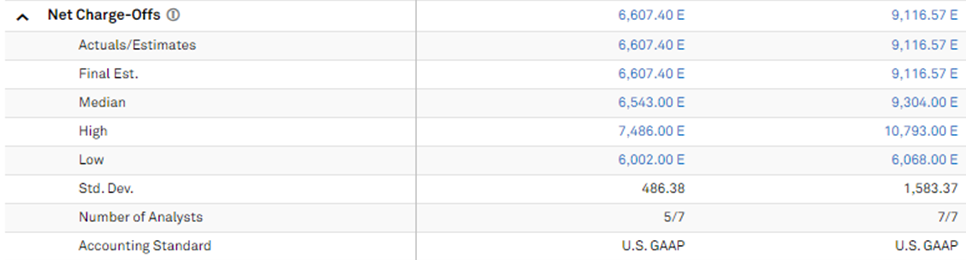
Net Charge-Offs (NCOs) are an additional critical measure to monitor, particularly as several recent announcements have pointed towards a potential normalization in credit quality and rising charge-offs. NCOs refer to the amount of loans or credit card balances that a financial institution has written off as losses due to a borrowers' inability to repay them, and are an important measure of the overall health of a bank’s loan portfolio.
For JP Morgan, net charge-offs as shown below are expected to grow from $6.6bn in 2023 to $9.1bn in 2024, a sizable 38% increase that may foreshadow anticipated economic instability by analysts in the coming year.
![]()
Additionally, Net Interest Margin (NIM) is an essential estimate offered by S&P for industry practitioners to project bank profitability. A measure of net profitability of a bank’s spread business, NIM is defined as net interest income divided by average earning assets. As shown below, analysts project JP Morgan’s NIM to decline in the coming year, a potential signal of deteriorating economic conditions.

![]()

Industry-specific metrics have varied use cases across the financial services industry including investment banking, asset management, and equity research. Importantly, ratings agencies pay close attention to these items in determining their credit ratings decisions, as both Moody’s and S&P Global recently downgraded several regional US banks in part due to concerns over declining capital ratios and weakening funding metrics.
Visit our webpage for additional information on our expanded set of Industry Metrics and click here to request a connection with an S&P global representative.