
The first two months of 2023 registered a 3.7% price return on the S&P 500, after a negative -18.1% return in 2022. The uncertainties around inflation outlook and the geopolitical environment still overshadow the near to medium term future of the equity market.
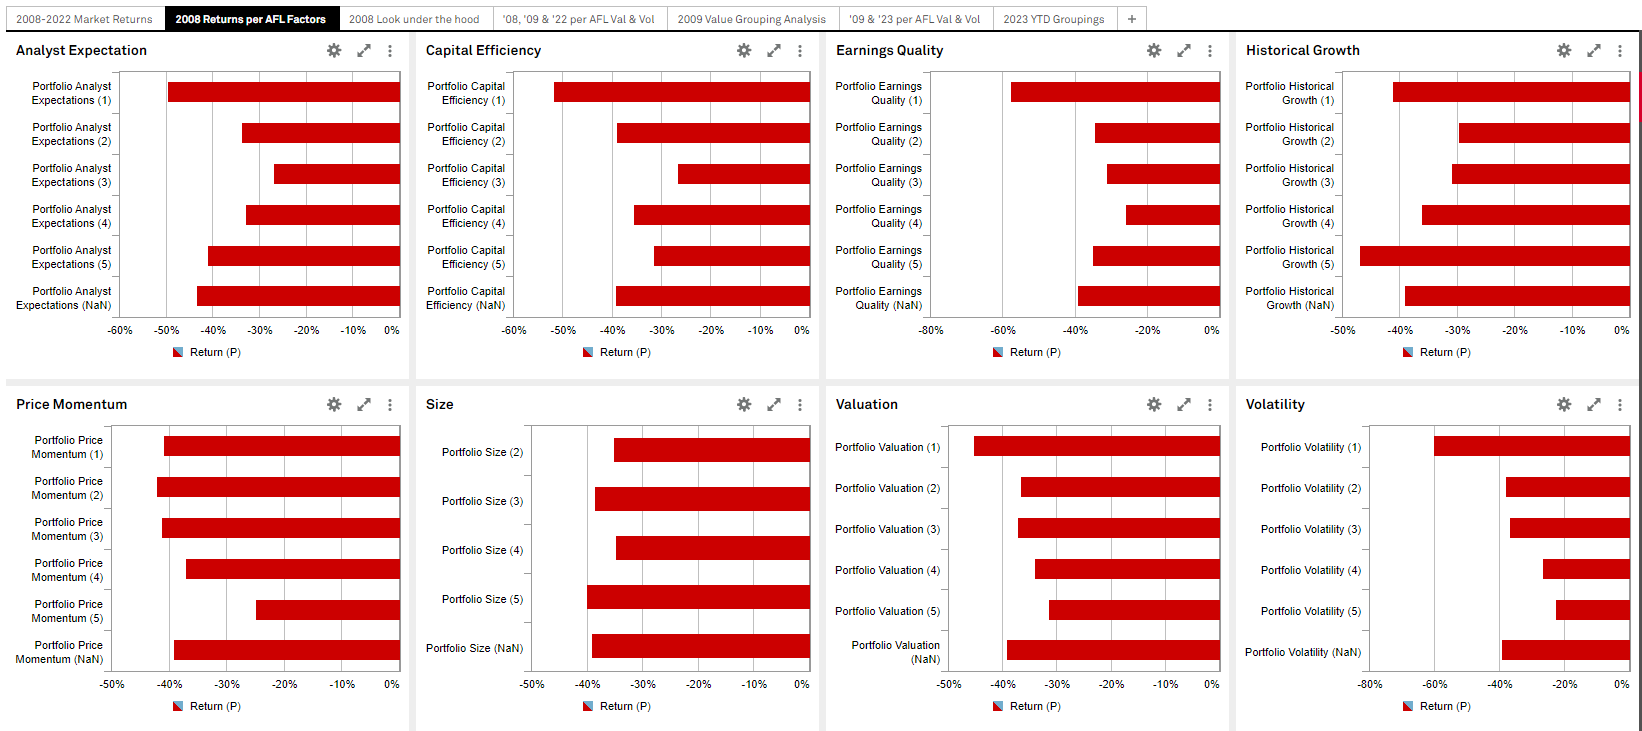
For some longer-term perspective, we studied the market shifts in Alpha Factor Library (AFL) performances during the last bear market in 2008 and the following year in 2009 to see if a similar pattern occurred during 2022. We started by quintiling the eight different factor styles: Price Momentum, Historical Growth, Analyst Expectations, Earnings Quality, Valuation, Capital Efficiency, Size, Volatility into five equally weighted/market capitalization buckets.
(These links above are accessible by clients only. If you are not a current client and would like to request a demo, please click here.)
Source: S&P Global Market Intelligence as of February 28th, 2023. Charts are for illustrative purposes only.
We noticed the strongest direct correlation in performance occurred from the valuation and volatility factors as shown in the two bottom squares on the right in the above visual. The up-side down stair-steps are indicative of, in the valuation factor square, the most expensive names underperforming and the cheapest relatively out-performing their growth counterparts, and in the volatility factor square, those securities with the highest degree of volatility proved to have the weakest returns, while the less volatile names out-performed their peers, but still had negative returns in 2008.
We first conducted the same analysis using sector-neutral grouping to ensure the same pattern existed just as it did cross-sectionally:
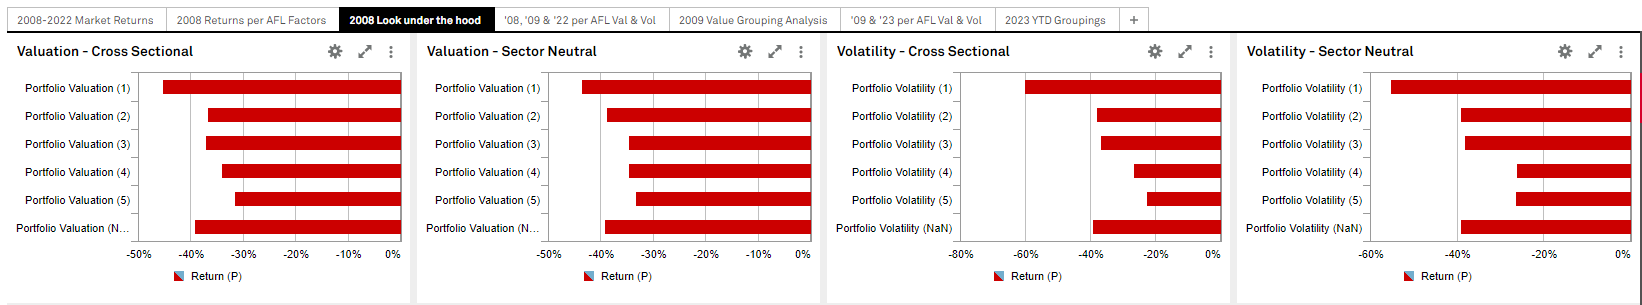
Source: S&P Global Market Intelligence as of February 28th, 2023. Charts are for illustrative purposes only.
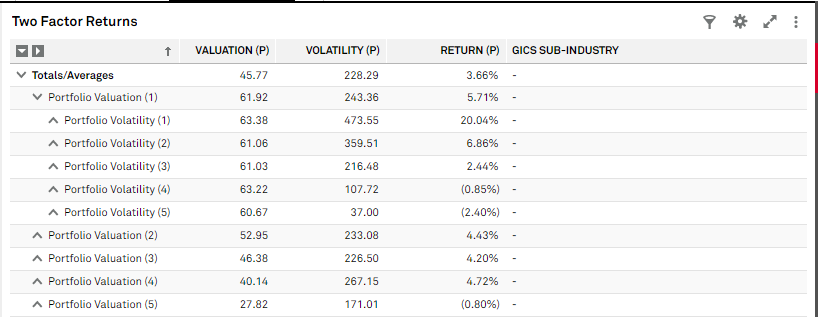
We then compared the 2008, 2009 and 2022 performances of those two factors using the same equal-weighted quintiling methodology:
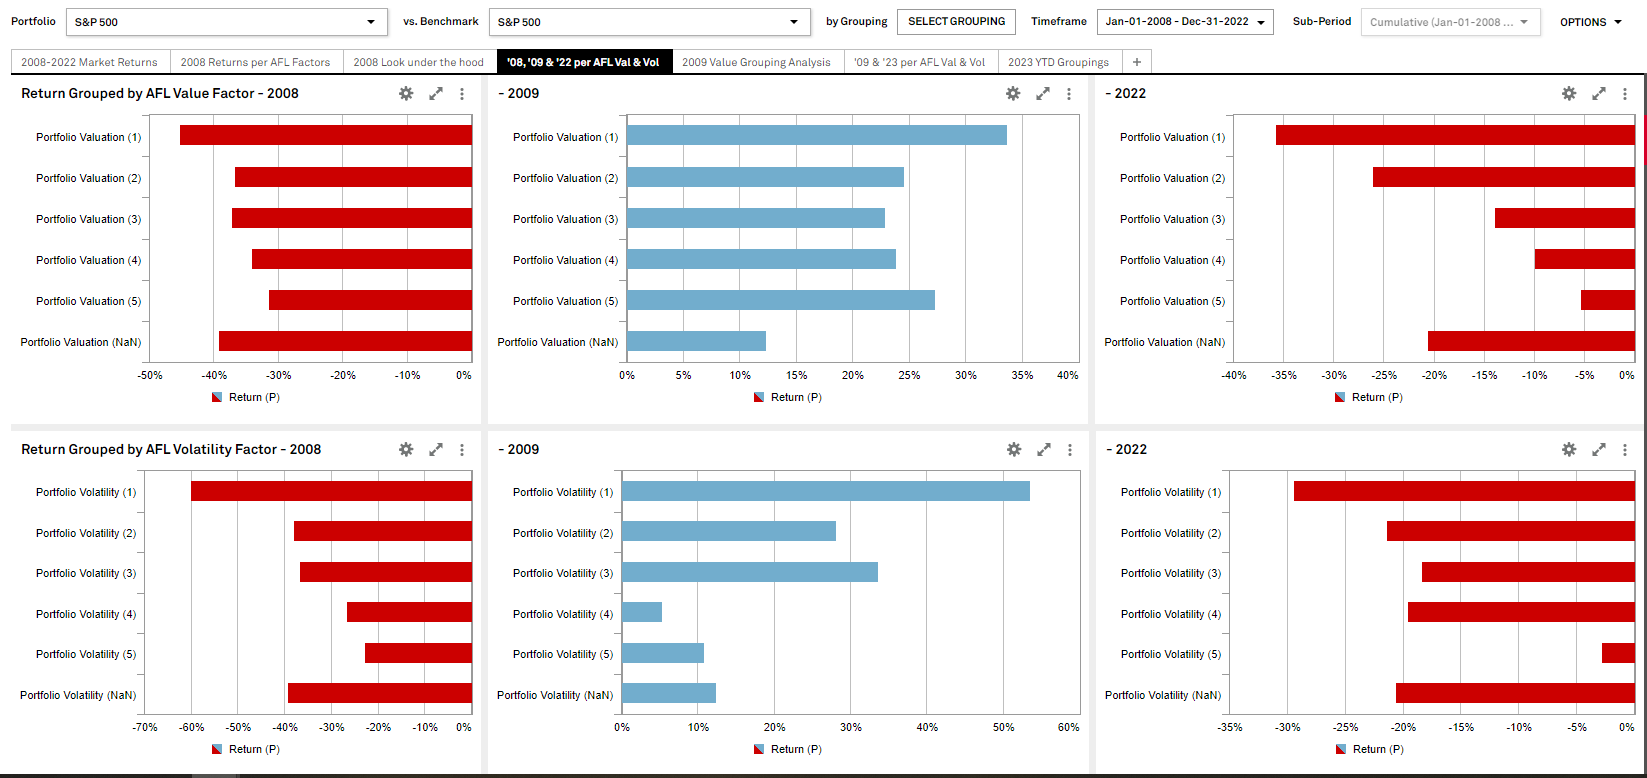
Source: S&P Global Market Intelligence as of February 28th, 2023. Charts are for illustrative purposes only.
We observed very similar patterns in 2022 vs. 2008 and mirror-image patterns in 2009 vs. 2008.
The inferences that can be drawn from the two screens above are:
- High valuation and volatility stocks performed the worst during the 2008 bear market.
- The same pattern existed in 2022.
- The inverse occurred in 2009 with the top quintile of value and volatile stocks performing the best.
We then checked the statistical validity of these observations to ensure there is an even distribution of stocks in each of the quintiles (roughly 100 in each bucket), no strong correlation among the two factors, and that the majority of the stocks fall into the middle of the valuation factor and price return range:
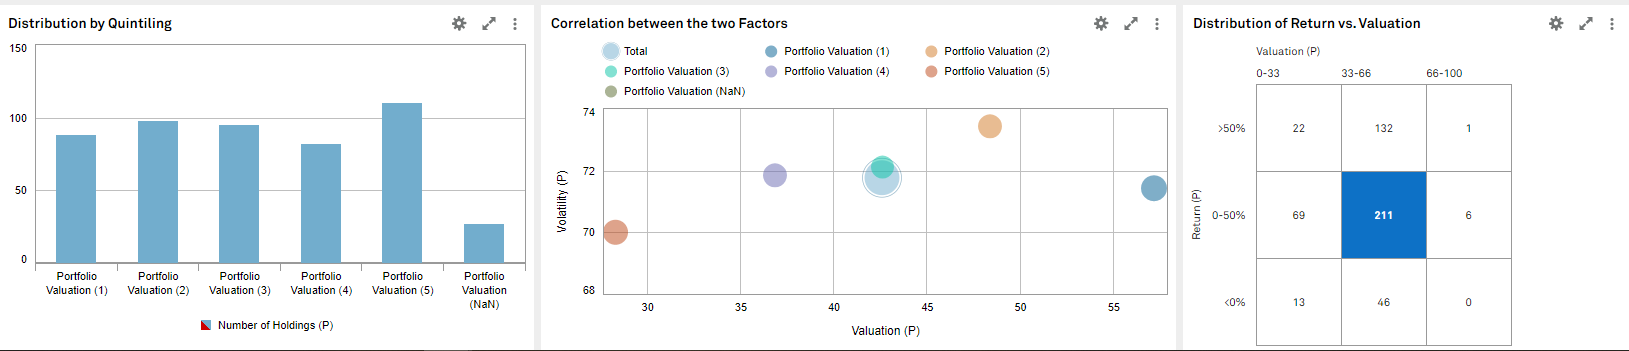
Source: S&P Global Market Intelligence as of February 28th, 2023. Charts are for illustrative purposes only.
With that reassurance, we identified the group of stocks that had both the highest valuation and volatility values at the beginning of 2023. Presented below are their corresponding year-to-date performances:
The above study is carried out using our Portfolio Analytics solution on the Capital IQ Pro platform. For further information on using and understanding the analysis, please request a demo.
Copyright © 2023 by S&P Global Market Intelligence, a division of S&P Global Inc. All rights reserved. View website disclosures here.