
There has been no end to headlines focused on CEO compensation, along with the scrutiny that goes hand-in-hand with the topic. Ever-increasing executive compensation over the past four decades – aided by consultants, compensation committees, the CEOs themselves, and the backdrop of an extended bull market (1982-1999) – has meant widespread acceptance of the link between CEO pay and performance.
Still, consider this – what if there was no link between jaw-dropping CEO pay and performance? Research suggests there isn’t.
A recent report from the Quantamental Research Team at S&P Global Market Intelligence has found that executive pay itself is not a firm indicator for future stock performance, and instead, market players should look at the behavior of CEOs and activity pertaining to their stock option holdings.
‘Skin in the game’, if you will, is not just a good motivator; it is a good market signaling mechanism.
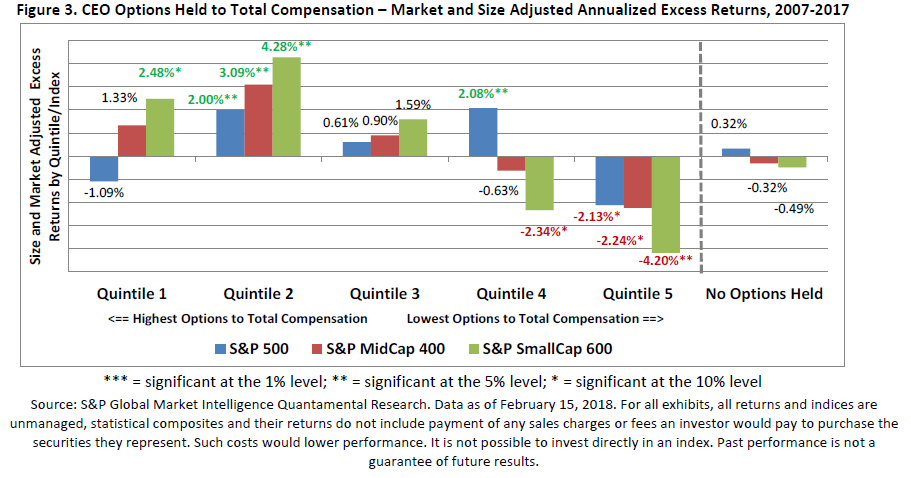
Our research shows that companies where CEOs have large stock option holdings have historically outperformed their index, in aggregate, over subsequent quarters.
This makes sense, when you consider that stock options represent a leveraged bet on share price. For example, if a CEO holds 100,000 options with a $50 strike price and the current share price is $51, the position is worth $100,000, but at $60 (an 18% price increase) it’s worth $1,000,000 (a 900% value increase). So it stands to reason that executives who have the means to influence financial results and the share price are therefore highly motivated to do so.
Additionally, CEOs with large option holdings tend to repurchase more shares, which boosts earnings-per-share-growth – a signal of confidence, issue more debt to fund share repurchases, and engage in less merger & acquisition activity than peers (M&A tends to be value destroying).
S&P Global Market Intelligence data show that large stock option holders work for companies where 3-year earnings-per-share growth is markedly above peers, driven by higher-than-average sales growth and margin improvement.
Conversely, firms where the CEO has a small stock option holding have, historically, underperformed their index, in aggregate, over subsequent quarters. Low stock-option holders tend to work for companies where 3-year earnings-per-share growth is a notable 50% below peers, driven by below-peer sales and margin growth. Equally, watching for option strikes is a good indicator of future stock price weakness – suggesting low confidence from the CEO for their firm’s financial performance.
Note: these effects are most pronounced in mid- and small-cap stocks (S&P 400 and 600 issues). In scenarios where a CEO has no option holdings there is no signaling power and results are in line with peers.
Take, for example, five top companies in 2017 by CEO options held to total compensation, you’ll find returns were on average a notable 29% above firms’ respective equal-weighted sectors. These companies have CEO options held to total compensation at an average ration of 21.3, with the CEO’s holdings on average 91% exercisable.
The numbers are certainly intriguing. So, what can we take away?
Our data shows that total incentive compensation – performance-based cash plus stock and stock option awards – for S&P 500 CEOs has averaged 77% of total compensation over the past 10 years.
As a result, total CEO incentive compensation paid over this period was nearly $44 billion.
Considering the sheer size of a decade’s worth of exec payouts, had the amount of incentive compensation paid made a difference for shareholders? This research certainly suggests no. But as our research also shows that there is a real benefit in using executive compensation data as potential market signals by looking at the form of the compensation and also the executive’s behavior – retaining versus exercising the options, perhaps investors themselves have a clear incentive to follow the data.
How We Got Here - A Brief History of US Executive Compensation
The timeline below provides a sketch of how median large-company CEO pay rose from about 20 times that of the average worker in the 1960s to an estimated 300 times currently, and highlights some of the major regulations likely to affect future compensation.
- 1960s: CEOs of major U.S. corporations earn about 20 times the salary of the average worker (1965). Mostly comprised of salary and short-term bonus, CEO pay is based on “internal equity,” or fairness of pay distribution within the company.
- 1970s: CEO pay estimated to be 20 to 30 times the average worker’s salary. A new industry called “executive compensation consulting” develops. Consultants become evangelists for “external equity,” or fairness versus peers.
- 1980s: Rise of compensation consultants and “benchmarking” (see Section 1.1 below). CEOs hire the consultants. Median CEO pay rises 50% versus the 1970s.
- 1990s: IRS Section 162(m) (1993): pay above $1 million can be deducted only if it is performance-based. CEO pay rises by 16% annually from 1991-2001, driven in part by stock option values. Industry observers estimate that CEO pay reaches almost 400 times the salary of the average worker by 2000.
- 2000s: FAS123R (effective 2005. Financial Accounting Standards Board (FASB) rule, not a regulation) requires all U.S. firms to expense stock options. Use of restricted stock rises, especially after the 2008 bear market renders many options worthless. 2006: SEC significantly increases executive compensation disclosure rules, in response to options backdating and other scandals.
- 2010s: Median S&P 500 CEO pay rises 30% in 2010, after falling in 2008-2009.
- 2011: Dodd-Frank Act adds annual shareholder vote on executive pay.
- 2015 pay ratio rule: U.S. public companies must disclose ratio of CEO total compensation to median annual pay of all employees (effective in 2018).
- 2017 tax bill: all executive pay above a $1 million is non-deductible (reverses IRS Section 162(m)).
Access the complete research here.
S&P Global Market Intelligence’s opinions and analyses are statements of opinion and are not investment recommendations or investment advice.