
Confirming grim fears about the $1.2 trillion U.S. leveraged loan asset class, the coronavirus pandemic cut a broad swath through corporate earnings in the second quarter, resulting in the deepest plunge in profits for public filers within the S&P/LSTA Loan Index since LCD started tracking the metric in 2002.
At negative 23%, the year-over-year change in EBITDA followed on a 9% drop in the first quarter, and exceeded the prior peak decline of 18%, recorded in the first quarter of 2009, as the Great Recession descended.
Request a demo of LCD to see more of the top leveraged finance stories from 2020
Click here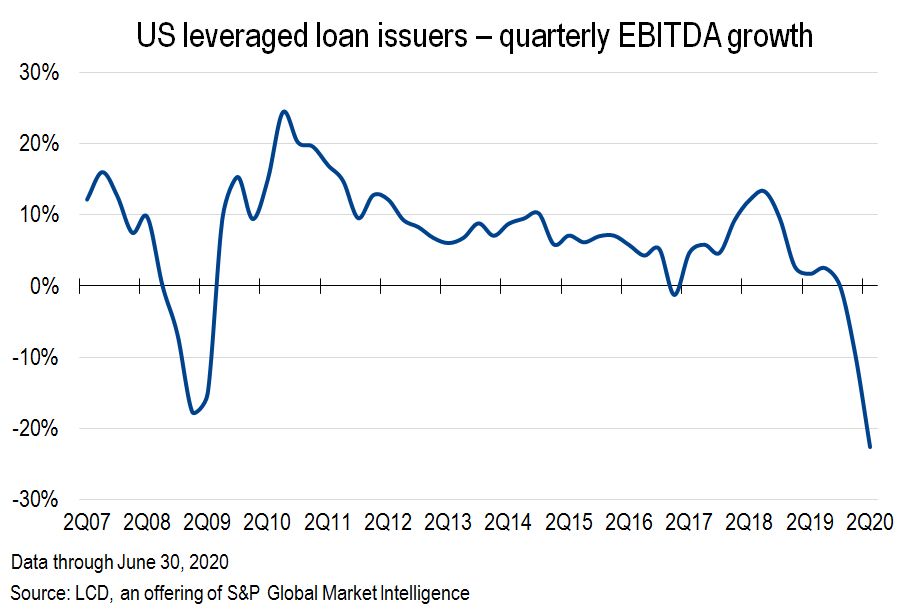 |
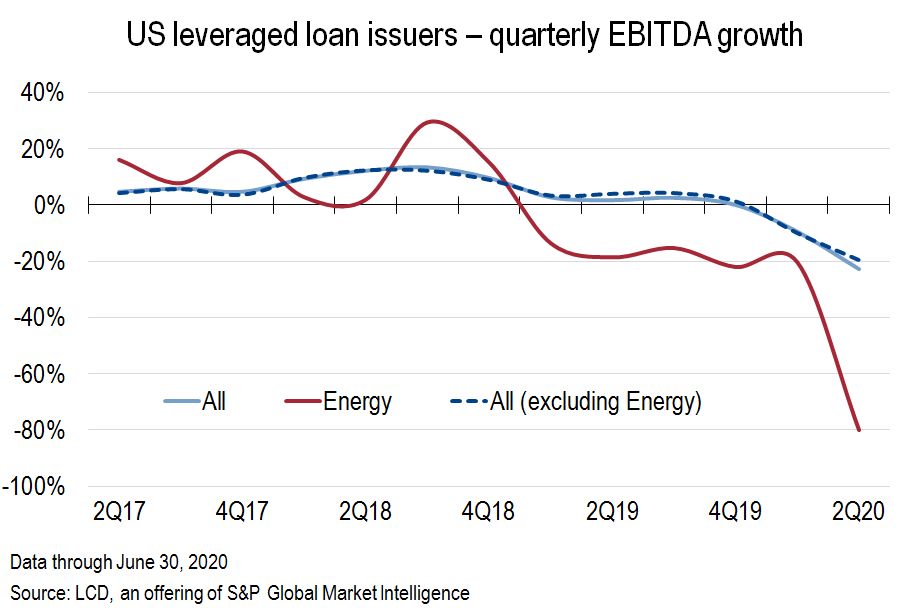 |
Predictably, the Loan Index constituent declines were most severe and widespread in industries directly exposed to fallout from lockdown dynamics, including automotive, hospitality and casino, commodity metals and oil & gas. That matched the pattern across the broader S&P 500, per analysis from S&P Global Market Intelligence. For earnings compiled to Aug. 7, year-over-year EPS declines were most pronounced in the energy (negative 169%), industrials (negative 83%), consumer discretionary (negative 78%) and real estate (negative 53%) sectors, versus negative 53% for all reporting S&P 500 constituents. Bucking the trend were slim gains for utilities, healthcare and information technology, and a more modest 7% decline for consumer staples.
For the latest quarter, LCD used 170 loan issuers within the S&P/LSTA Index that file results publicly.
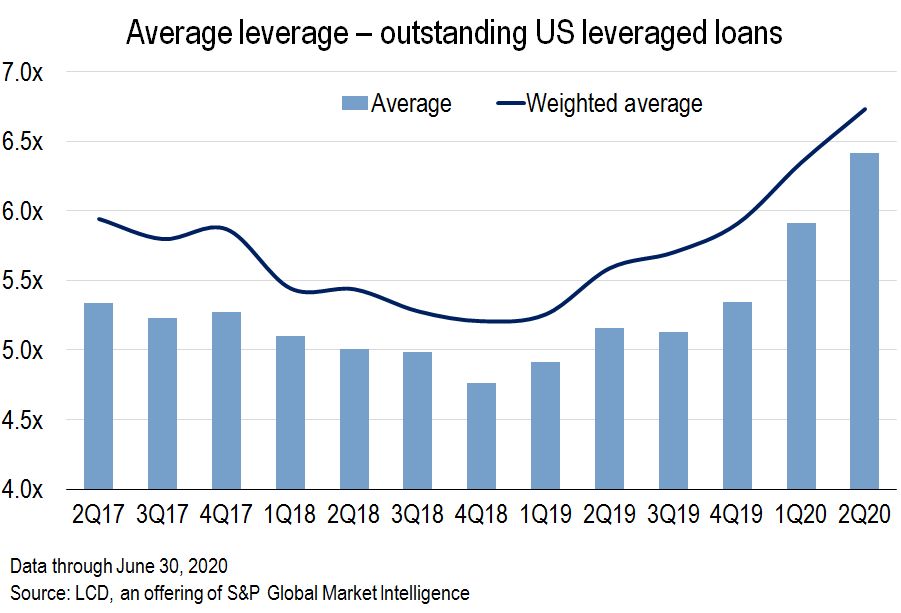
The blow to earnings leaves the credit markets in uncharted territory. LCD-calculated leverage (debt to EBITDA) soared to 6.4x on an average basis in the second quarter across that group of loan issuers, up half a turn from the first quarter, adding considerable distance from the healthiest reading of the now-derailed, decade-long economic expansion, or the 4.76x leverage reading in the final quarter of 2018.
 |
In the first quarter of 2020, the comparable sample from the S&P/LSTA Index managed to eke out a slim, 1% year-on-year increase in revenue, based on relatively unimpeded economic conditions in January and February, ahead of the lockdown that devastated economic performance in March. That first-quarter number extended a remarkable string of 42 straight quarters of top-line growth.
While many states attempted gradual re-openings by June, revenue tumbled 13% across the 170 issuers in the second quarter. The prior revenue contraction dates to the throes of the Great Recession, in the third quarter of 2009, when the comparable revenue reading was negative 3%. The sharpest decline in the wake of the 2008 financial crisis was the 11% drop in the second quarter that year, on top of a 7% slide in the first quarter, and a 5% drop in the final quarter of 2008.
Request a demo of LCD to see more of the top leveraged finance stories from 2020
Click hereThe historic economic expansion over the last decade already showed signs of stalling ahead of the emergence of COVID-19. Revenue growth for the final quarter of 2019 rivaled the weakest reading since 2009, and EBITDA growth was near zero.
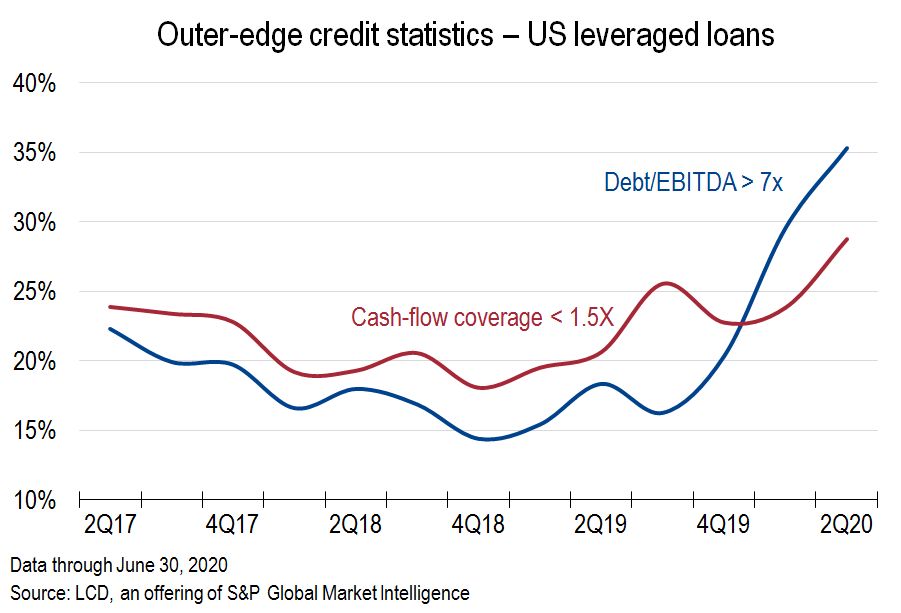
The resulting rise in leverage (debt/EBITDA) has a record share of the Index skating on precariously thin ice.
A staggering 35% of the 170 public filers LCD tracks within the S&P/LSTA Index carried leverage greater than 7x into the third quarter, nearly double the proportion a year earlier, and up from 14% at the cycle low for leverage, in the fourth quarter of 2018. For reference, that "outer-edge" proportion of highly leveraged credits was just 20% in the final quarter of 2008, and 16% a year later.
 |
Of course, the limited sample size does not necessarily paint a complete picture. The 170 issuers tracked here represent a relatively small 15% of the overall performing issuers in the S&P/LSTA Index. With that caveat in place, the 7.8x leverage level for the 34 issuers with a straight B rating still stands in stark relief, marking a rise from 7.3x in the first quarter this year and 5.9x in the first quarter last year.
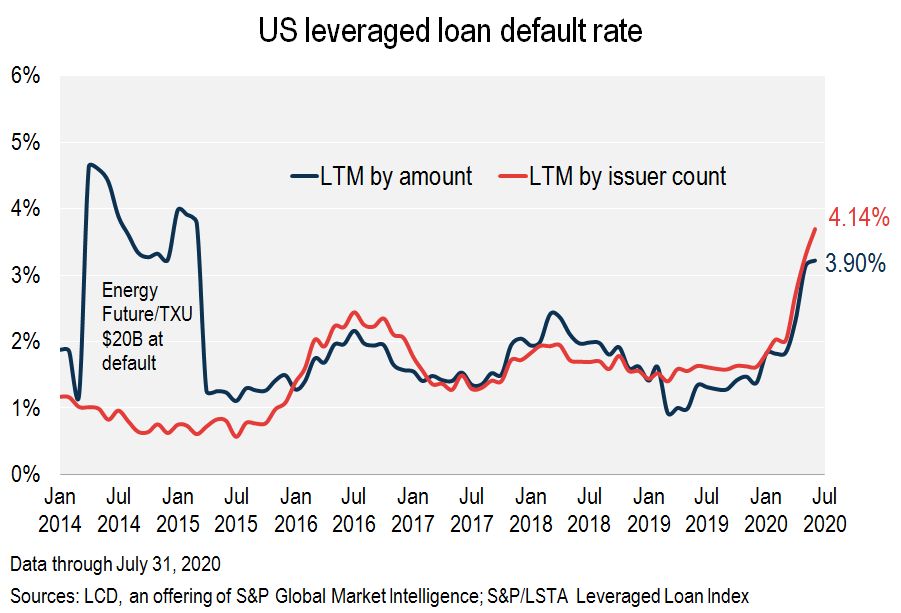
The spike in recorded leverage also dovetails with a surge in loan defaults since March. Five issuers within the S&P/LSTA Index defaulted in July, pushing the U.S. default rate above 4% by issuer count for the first time since 2010. By dollar amount, retail broke a sector-level default record in May at 14%, and the oil & gas sector did so in July, at 31%.
 |
While there's no way to sugarcoat this bitter pill, many issuers over the last decade — and, indeed, in the shadow of the pandemic — considerably bolstered their defenses against a downturn by tapping the debt markets to extend maturity profiles and refinance at historically attractive funding costs. Record high-yield bond issuance since May has included the lowest-ever high-yield bond coupons recorded, and average new-issue yields earlier this month dipped to new lows for records kept since 2006.
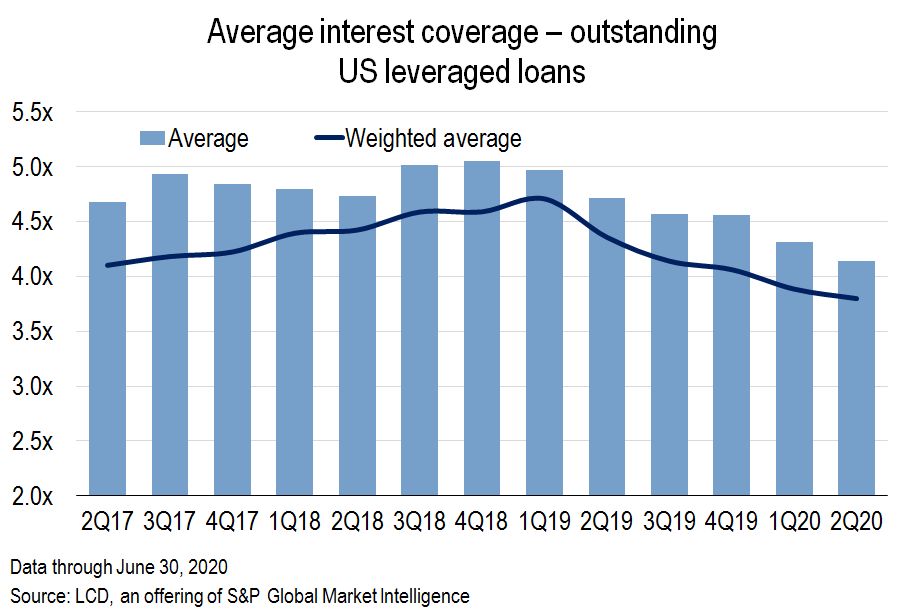
Average interest coverage across the 170 issuers in the second quarter dipped to a seven-year low of 4.1x, down from more than 5x in the final quarter of 2018. Still, that latest reading is a full turn better than the lowest readings in the Great Recession.
 |
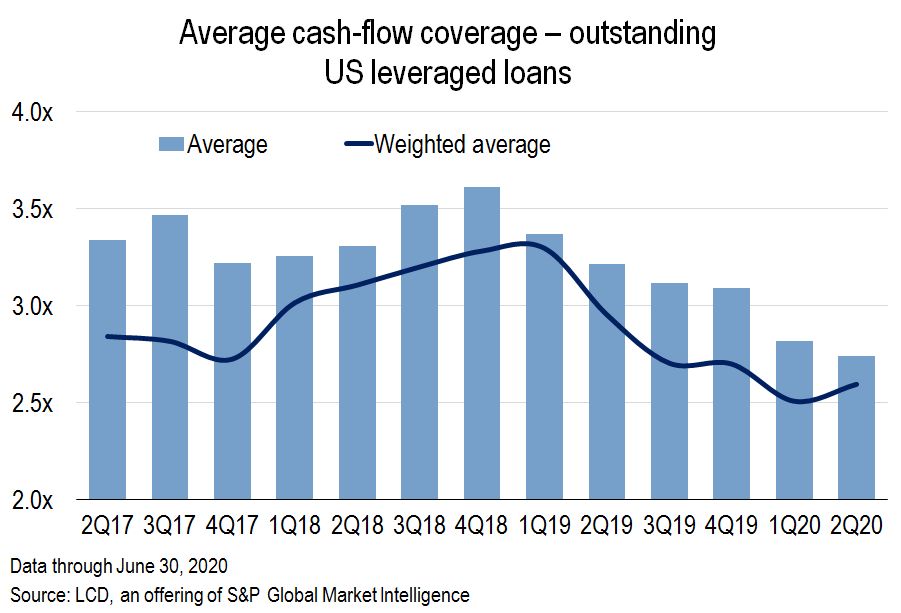
Similarly, average cash flow coverage, at 2.7x in the second quarter, was off from a cycle peak at 3.6x in 2018's final quarter, but still above the low-water mark at 1.8x in the last quarter of 2008.
 |