
The average annual US solar capacity factor tracked closely to the norm in 2022, hovering near the mid-20% mark. But with a gap of more than 20 percentage points between apex and nadir, monthly metrics are a stark reminder of photovoltaic energy production seasonality — an element that compounds the intermittency challenges of the renewable energy transition.

The estimated average capacity factor of operating US solar projects remained steady in 2022. A new S&P Global Commodity Insights analysis of monthly averages, however, underscores the peaks and valleys of solar energy performance as the earth completes its orbital revolution around the sun, notably a significant drop from November through January.
Maximum solar capacity factors mostly align with current peak load periods, when summer sunshine and heat drive air conditioning usage higher. But the electrification of heating systems could lead to winter loads not too far removed from summer levels, increasingly posing the question of photovoltaic contributions to energy production at times that used to be of comparatively smaller concern.
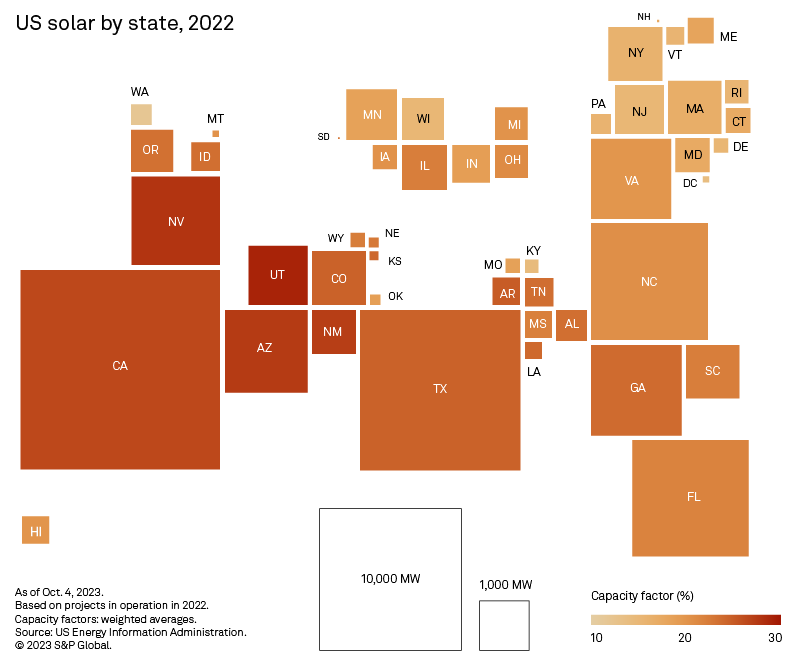
Top US solar capacity factors are found in the US southwest. The region, which mostly experiences mild winters, is home to the bulk of the US operating and planned utility-scale solar generation fleet.

The US utility-scale solar generation fleet averaged a 24.2% capacity factor from January through December 2022, slightly down from 2021 levels. Performance peaked in June, with the weighted average capacity factor for projects in operation in 2022 reaching a calculated 33.2%; it bottomed out at 12.3% in December.
S&P Global Commodity Insights estimates show average US solar capacity factors languishing in the low to mid-double-digit territory in November, December and January — a time of year when electricity consumption historically has dipped with heating load mostly met by natural gas. Heating electrification, however, is expected to push power demand higher in cold weather, increasingly posing the question of grid reliability in the winter months as the share of renewables, notably solar, grows in the production mix.
From this perspective, the US southwest, unsurprisingly, has an edge over the rest of the nation. Not only does it boast the highest US solar capacity factors, but winters in the region generally are mild. Desert Southwest states dominate the 2022 US solar capacity leaderboard. Utah continues to rank first, with a calculated grid-scale annual solar capacity factor of 29.2%. Nevada is only 1 percentage point behind. Arizona and New Mexico, respectively, rank third and fourth but are essentially neck and neck.
In Utah, the ratio of actual generation to the maximum nameplate output peaked at 40% in June but fell to 13.2% in December. The state has particularly sunny summers and solar resources are abundant year-round in its southern half. Winters in the north, over the Wasatch Mountain Range, are generally cold and snowy, however. In Arizona, Nevada and New Mexico, average solar capacity factors also hit their trough in December, ranging from 13.8% to 16.4%, but reached their zenith in May, topping 37%.
December marked the lowest level for estimated capacity factors in 39 states. In Florida, a handful of basis points made November slightly less performant than December. November was also the bottom in Kansas. Six states along the northern half of the Atlantic seaboard — Maryland, Maine, New Hampshire, New York, Rhode Island and Vermont — and Washington State logged their lowest monthly average solar capacity factor in January, when the metric fell into low single-digit territory, except in Maryland. Furthermore, capacity factor peaks across the group trail those of the Desert Southwest by roughly 10 percentage points.
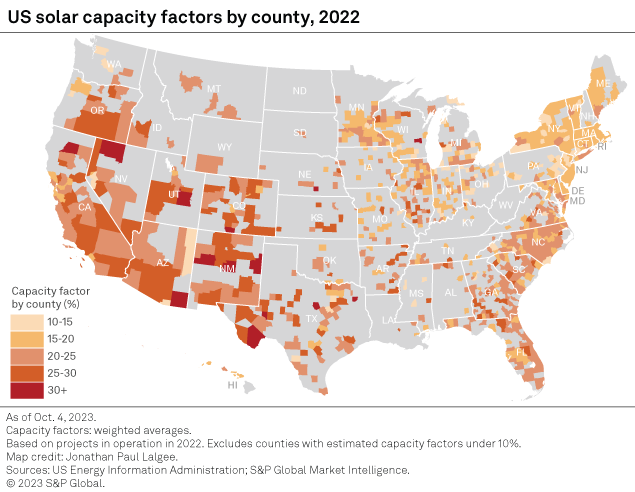
California, which hosts the largest US grid-scale solar portfolio, logged the fifth-highest large-scale solar capacity factor in 2022 — 26.8% — but performance varies markedly across the latitudinally stretched state. S&P Commodity Insights identified 41 California counties with large-scale solar capacity, of which 17 had an annual capacity factor above the national average in 2022. The bulk of those high-performing counties are situated in the southern half of the Golden State. Shasta County, further north, is an exception, but the geography counted only one operating solar plant in 2022 — 3 MW PSEG Shasta Solar Farm I & II (Ahjumawi).
Texas, second only to California in operating grid-scale solar capacity, had the seventh-largest state solar capacity factor, averaging 25.1%. Fifty-three of the 61 Texas counties operating utility-scale solar generation in 2022 had a solar capacity factor of at least 20%; 29 topped the national 24.2% average. As of writing, Texas had a 13.5 GW large-scale solar portfolio. It also had 90.3 GW of additional capacity in planning, or more than a third of the overall US pipeline, putting the state on a path to having the largest solar generation fleet in the US, edging out California by a nearly 3-to-1 ratio.
Data visualization by Chris Allen Villanueva, Senior Designer.
Map by Jonathan Paul Lalgee, Manager, Cartography.
For wholesale prices and supply and demand projections, see the S&P Global Market Intelligence Power Forecast.
Regulatory Research Associates is a group within S&P Global Commodity Insights.
This article was published by S&P Global Market Intelligence and not by S&P Global Ratings, which is a separately managed division of S&P Global.