
Averaging 14% of overall U.S. generation, the estimated contribution of renewables to U.S. independent system operator energy production falls into high single-digit territory at peak hour, underscoring current green energy limitations when households and businesses need electricity the most. Projects in the pipeline, however, suggest sizable improvements are in the near future, notably in renewable hotbeds California ISO and Electric Reliability Council Of Texas Inc.

Renewable generation in the U.S. is on the rise, with the sector propelled by powerful tailwinds arising from environment and energy security concerns.
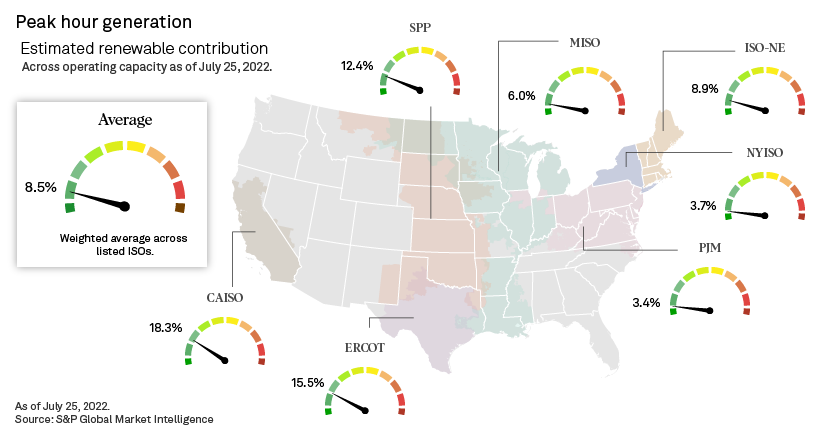
Averaging 14% of overall U.S. generation, however, renewables contribute only 8.5% of peak hour generation across U.S. ISOs, according to an S&P Global Commodity Insights analysis of operating legacy and renewable capacity.
Given existing, but also potentially upcoming, renewable portfolio standards and, more broadly, widespread support at the highest echelons of government, additional monetary and fiscal incentives to develop the space may thus be expected.

The estimated metric varies widely across the designated geographies, reflecting natural resource conditions on the ground and local energy transition policies and strategies. Given the intermittency of solar and wind, or the impossibility of calling on those resources at will, these two components, in most cases, are not mutually exclusive, bringing to the fore the criticality of long-term storage solutions in the pursuit of ambitious renewable portfolio standards. These dynamics also suggest that a full transition away from easily dispatchable legacy fuels might be a long way off.
In this context, our analysis unsurprisingly showed sun-kissed CAISO and radiant and windy ERCOT leading the ISO pack in renewable contribution to peak-hour generation across current operating capacity, at an estimated 18.3% and 15.5%, respectively. The windy Southwest Power Pool is the only other ISO in double-digit territory, rounding out the top three. The rest of the field is far behind, with a large chunk of the East Coast through the New York ISO and the PJM Interconnection LLC, both under 4%, bringing up the rear.
|
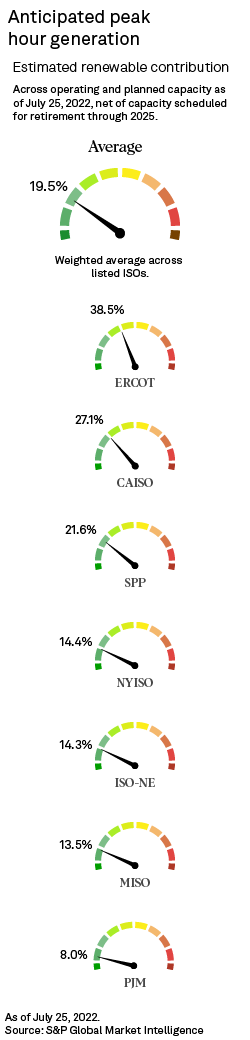
Across the analyzed territories, utility-scale solar and wind portfolios are poised to expand dramatically, by 350% and 72%, respectively, based on current operating and planned levels. As seen, however, running time at photovoltaic and wind developments are subject to the whims of Mother Nature, regardless of size. Modeling exercises around planned supplemental capacity suggest renewables' contribution to peak-hour energy production could top a weighted average of 19% by the mid-2020s, with fossil fuels preserving a nearly two-thirds contribution — with natural gas alone at about 50%.
Historically heavily reliant on fossil fuels — and still popularly associated with Big Oil — Texas, which essentially mirrors ERCOT geographically, is taking the green energy bull by the horns by capitalizing on its vast solar and wind resources, despite a long-surpassed renewable portfolio standard. The ISO leads the nation in wind energy. The utility-scale solar front is primed for a sevenfold jump in capacity based on current operating and planned levels, positioning itself for record renewable contributions to peak-hour production, according to our analysis.
Enveloping virtually all of California, CAISO looks poised to fall to second place in peak-hour renewable energy contribution, despite a nonnegligible uptick. Throwing hydroelectricity into the mix, however, showed that combined solar, wind, biomass, geothermal and hydroelectric sources could contribute about 45% of the ISO's peak-hour generation based on current operating and planned capacity. Furthermore, per our model, CAISO is the only ISO looking at peak-hour fossil fuel reliability falling below the 50% mark, even dipping below 40%.
The SPP hangs on to its No. three ranking in our analysis, with renewables contributing nearly 22% of peak-hour generation post currently planned capacity versus 12.4% today. The SPP boasts one of the largest wind portfolios, with plans to augment that capacity by more than 50% based on projects in the pipeline. The region's belated move into the utility-scale photovoltaic space, however, weighs on its renewable performance at peak hour. The SPP has 5.2 GW of solar in the works, but it operates only 430 MW of solar capacity, or less than 1% of the U.S. ISO total, as of this writing.
Facing renewable-development headwinds such as subpar solar and wind conditions, a high population density, and elevated development costs, New York nonetheless has an ambitious renewable portfolio standard, targeting 70% electricity from renewables by 2030. As of this report, the Empire State was looking to increase its utility-scale solar capacity by a factor of 10 and grow its wind portfolio by roughly 400%, notably via a big bet on offshore wind. That said, the New York ISO ranks fourth in renewable generation at peak hour, according to our analysis of currently operating and planned capacity.
Serving states with generally aggressive renewable portfolio standard targets, with legislation in Maine notably calling for 100% renewable energy sales by 2050, ISO New England has ample amounts of solar and wind, including offshore, capacity in development. Massachusetts accounts for 30% of offshore wind currently planned on the East Coast. Straddling some of the northernmost latitudes in the contiguous U.S., the region enjoys long daylight hours in the summer — a boon for photovoltaic generation. At peak hour, however, generally slower winds weigh on overall renewable energy contribution to generation.
The Midcontinent ISO operates the second largest ISO-wide wind park, and it is looking to sextuple its solar capacity based on planned projects. The region is relatively close to NYISO and ISONE in renewable energy contribution to peak-hour production post planned capacity, at an estimated 13.5%, but proved to be the most fossil-fuel reliant ISO at that time based on this exercise. The region spans states that lean heavily on natural gas, including parts of Mississippi and Louisiana, both producing more than two-thirds of their energy via the fossil fuel. MISO also encompasses Illinois, where nuclear generation contributes significantly.
At the bottom of our analysis of renewable contribution to peak-hour generation based on operating and planned capacity, the metric comes in at an estimated 8% in PJM. States with nonnegligible heavy industry and fossil fuel legacies, including New Jersey, Ohio, Pennsylvania and West Virginia, make up the bulk of the ISO. The fortunes of West Virginia notably have long been tied to the coal industry. As of this report, West Virginia did not have an active renewable portfolio standard. Its cousin to the east, on the other hand, is targeting 100% renewable-source electricity by 2050. PJM thus far has prioritized nuclear in the carbon-free space, operating, by far, the largest ISO-wide nuclear portfolio. Adding nuclear and hydroelectricity to renewables showed that carbon-free sources could contribute nearly 30% of peak-hour production in the region.
Peak-hour energy production, which matches the time of day when electricity consumption is the highest, varies across coordinates, reflecting the influence of the daily evolution of local natural conditions on electricity demand. That said, in the U.S., peak hour generally occurs toward the end of the afternoon during the summer season, historically due to a surge in air conditioning usage. Technological advances and societal changes, however, could rewrite the hourly and seasonal scripts. For example, combined with an expanding solar portfolio, the electrification of the automobile sector could move the peak energy consumption needle closer to the middle of the day when insolation levels are at their zenith; smart appliances could increasingly be programmed to run at that time. With the widespread adoption of heat pumps, which run on electricity to warm buildings, winter could replace summer as the peak-demand season.
Modeling the contribution of renewables to peak-hour generation output across both operating and anticipated capacity levels involved the application of broad peak credit estimates across the various fuel portfolios in each ISO. With 2025 being the most distant known online year for projects in various stages of development, our look-forward analysis incorporated scheduled plant retirements from 2022 through 2025. Finally, for the sake of the theoretical exercise, the estimated renewable contribution category includes estimates for associated storage capacity.
The definition of renewables in this article does not include hydro or nuclear, which are often counted as zero-carbon fuels. All biomass units are included as renewables, though that definition can vary in state renewable portfolio standards. See the attached excel spreadsheet for a full breakdown of the results.
Regulatory Research Associates is a group within S&P Global Commodity Insights.
S&P Global Commodity Insights and S&P Global Market Intelligence are owned by S&P Global Inc.
Chris Allen Villanueva contributed to this article.
This article was published by S&P Global Market Intelligence and not by S&P Global Ratings, which is a separately managed division of S&P Global.