
In unison with the region's fast-expanding solar and wind generation fleets, utility-scale battery energy storage in the Electric Reliability Council of Texas Inc. service territory is projected to grow exponentially over the next decade. Aiding this growth are storage economics that are forecast to be relatively healthy. The S&P Global Market Intelligence Power Forecast shows battery energy storage systems in some parts of ERCOT reaching 80% of a full equity return for investors.

Firing on all green energy cylinders, despite a long-surpassed renewable portfolio standard, Texas leads the US in operating and planned wind energy as well as solar and battery storage capacity in development, with a battery energy storage system (BESS) pipeline accounting for 40% of the country's total.
ERCOT's combined solar and wind share of overall generation is projected to reach 43% by 2035. Capitalizing on these renewable energy dynamics, ERCOT is anticipated to offer relatively healthy battery storage economics, particularly in the region's west zone, where most of Texas' renewable projects are concentrated.

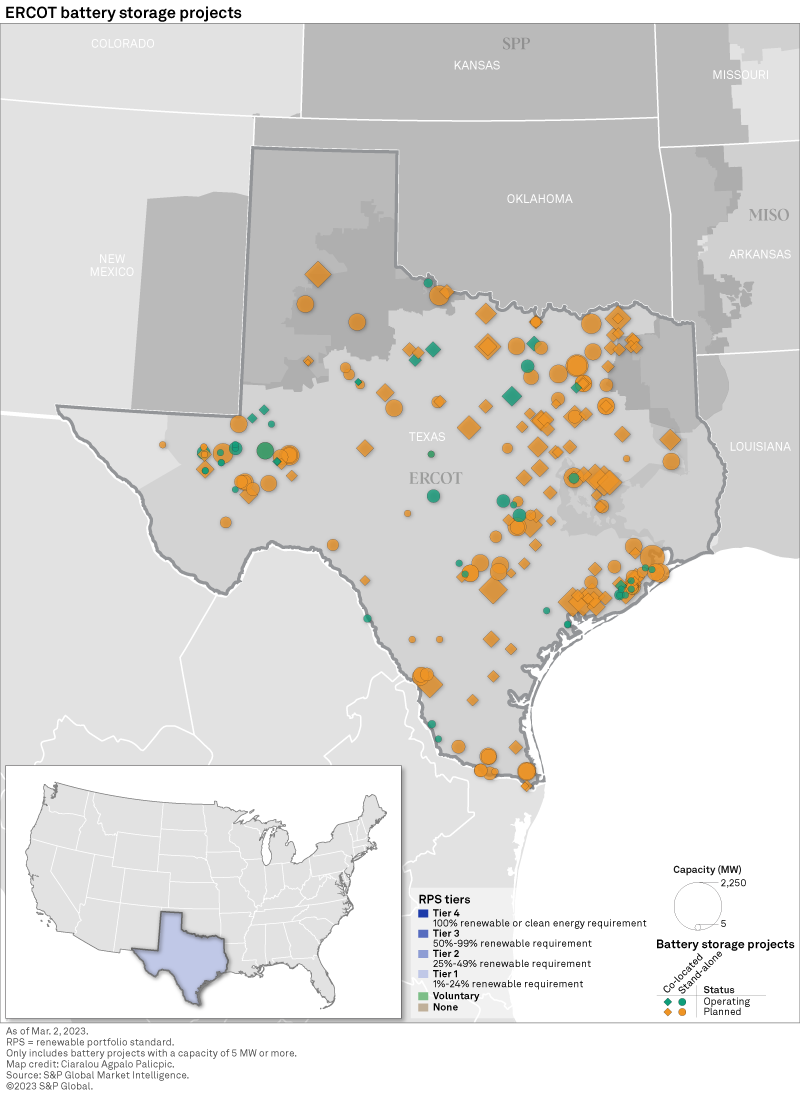
A deregulated market combining a business-friendly fiscal environment, land availability and favorable climatology, Texas — used interchangeably with the ERCOT footprint in this report — has been a magnet for renewable energy developers, spawning the leading wind generation fleet in the US as well as the largest utility-scale solar and battery storage pipelines in the country. Riding this green energy wave, corporate off-takers have been flocking to the state.
With 2.2 GW of operating large-scale battery storage, Texas trails only California and is planning for an additional 29.2 GW to come online by the end of the 2020s. The pipeline consists of 13 GW of stand-alone capacity and 16.2 GW of colocated storage systems, of which 97% are to be paired with a solar project. For perspective, Texas is planning to add about 78 GW to its existing 12-GW solar generation fleet. This is in addition to the state's 40-GW wind fleet — the largest in the US.
Overall, ERCOT has a combined operating and planned solar and wind capacity of about 150 GW, well ahead of the Public Utility Commission of Texas' targets of 5.9 GW of installed renewable energy by 2015 and 10 GW by 2025. Solar and wind generation served 28% of the load across the region in 2021 and 30% in 2022. Power Forecast projects ERCOT wind and solar generation will reach 36% of total generation in 2023 and 43% by 2035.
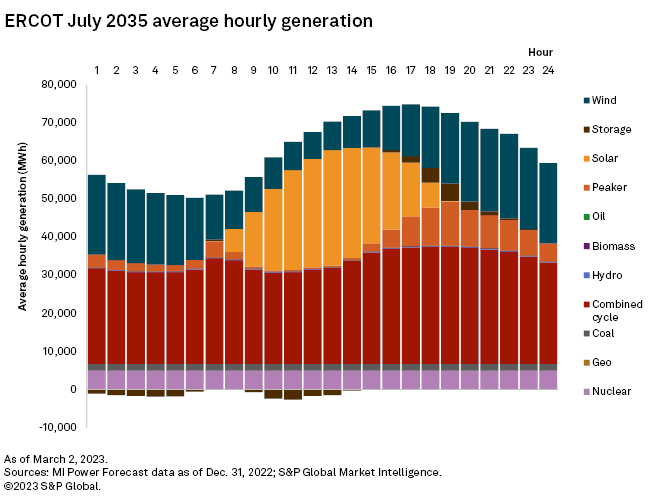
The projected average hourly generation for ERCOT in July 2035 illustrates the anticipated impacts of solar and storage in the region. Solar generation is concentrated between hour eight (8 a.m.) and hour 18 (6 p.m.), while gas combined-cycle generation remains steady throughout the day. Wind generation is strongest overnight and is forecast to drive half of storage charging. By 2035, solar availability accounts for the other half of peak-season charging. As the sun sets, storage discharges onto the grid, with the maximum call on storage projected at 4.5 GW. Even so, in July 2035, fossil peaking plants are forecast to still provide most of ERCOT's generation during the evening peak hours.
A high renewables penetration is correlated with good arbitrage opportunities for storage projects. That said, the renewable penetration rate varies across the independent system operator's vast territory. Characterized by a higher concentration of renewables and sometimes limited transmission, ERCOT West combines ERCOT's lowest hub prices with a price variability that leads to non-negligible arbitrage revenue opportunities.
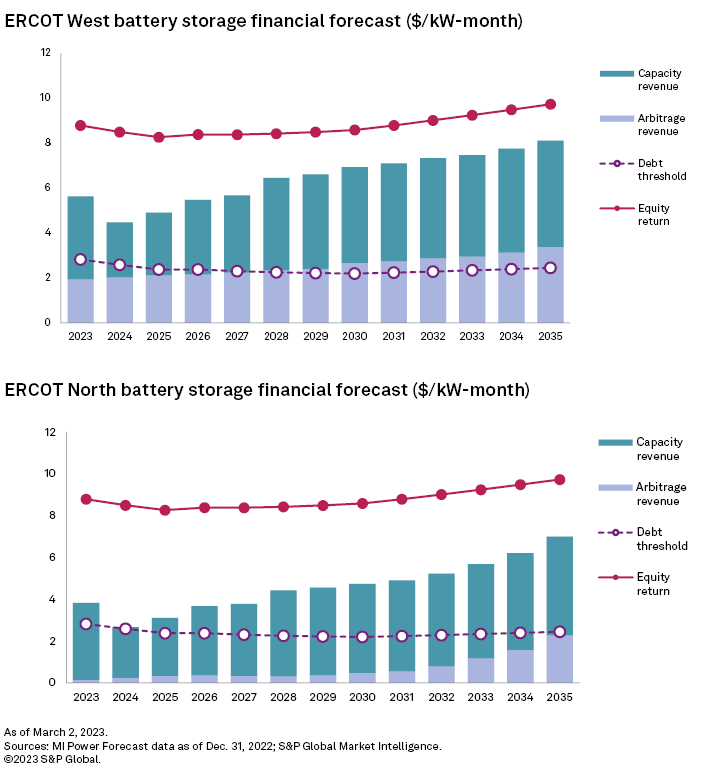
ERCOT West's projected arbitrage revenue steadily grows from $1.95/kW-month in 2023 to $3.38/kW-month in 2032, enough to meet the debt threshold from 2028 through 2035 by itself. Adding capacity revenues — which range from $2.44/kW-month to $4.73/kW-month — into the mix shows ERCOT West far exceeding debt service requirements throughout the forecast period and pushing battery storage value to more than 80% of a full equity return from 2030 through 2035.
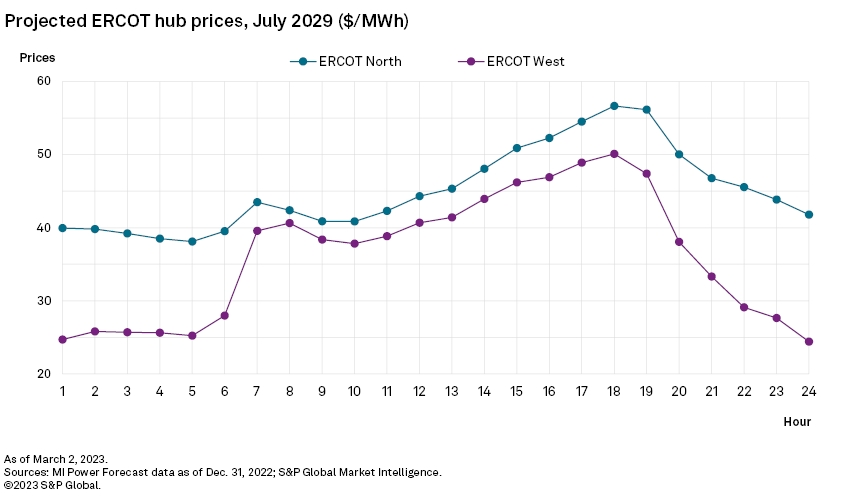
In comparison, ERCOT North, with a lower renewables penetration rate, has higher hub prices and smaller changes in average prices throughout the day. The projected July 2029 average ERCOT West price comes in at $36.18/MWh, versus $45.05/MWh for ERCOT North. As displayed above, average hourly prices for the month range from $24.42/MWh to $50.11/MWh in ERCOT West, compared to $38.10/MWh-$56.67/MWh in ERCOT North, underscoring the differential in arbitrage potential between the two zones.
Market Intelligence Power Forecast projects arbitrage revenues averaging 69 cents/kW-month from 2023 through 2035 in ERCOT North versus a $2.54/kW-month average in ERCOT West. Based on the forecast, most of the battery storage value in ERCOT North is in the zone's projected scarcity revenues, which mirror the projections across ERCOT West. Capacity revenue is the projected price increase for a project due to the operating reserve demand curve scarcity pricing in ERCOT. ERCOT North's projected scarcity revenue is generally enough to meet the zone's debt threshold, but combined revenues do not approach a full equity return through 2035.
For wholesale prices and supply and demand projections, see the S&P Global Market Intelligence Power Forecast.
Regulatory Research Associates is a group within S&P Global Commodity Insights.
S&P Global Commodity Insights provides content for distribution on Capital IQ Pro.
Chris Allen Villanueva and Ciaralou Palicpic contributed to this article.
This article was published by S&P Global Market Intelligence and not by S&P Global Ratings, which is a separately managed division of S&P Global.