
With the passage of the Inflation Reduction Act, which will solidify renewable energy tax credits for the next 10-plus years, prospects for land-based wind farms are rosier. This is a much-applauded boost to a wind energy sector that has seen a decrease in wind additions over the past year due to pandemic-related supply chain disruptions. The performance of a wind turbine is highly correlated with local climatology, with a turbine’s power output proportional to the cube of the local wind speed. Between 2000 and 2022, 100-meter wind speeds over the U.S. have increased, especially in the western half of the country, where wind speeds increased from 3% to 7%, positively impacting the power output of wind farms in the region. Over the windy Great Plains, however, not all states have benefited equally in the last 22 years, with some recording less than 1% growth.

Average wind speeds over most of the contiguous U.S. have increased over the last 22 years, with a percent change of 4% or greater concentrated over the western half of the U.S. and far Northeast.
The highest average wind speeds are found over the Great Plains. This combines with about 102 GW of operational wind capacity in the region.
Wyoming and New Mexico moved up the most in state ranking in the 22-year interval, up four spots, surpassing North Dakota, South Dakota and Minnesota.
Rhode Island ranks first in average wind speed, with 8.9 m/s average wind speeds; Utah ranks first in wind speed change from 2000 to 2022, up 6.4%.

With the passage of the Inflation Reduction Act, the U.S. energy transition is in full swing and is expected to increase the pace of building and connecting renewable energy. The changing climate, both human-induced and natural, underlays the energy transition. The slowing wind speeds that could be in part due to human-induced climate change were reversed in 2010 by natural climate cycles. This recent change in the climate cycle could last decades, positively impacting power generation at wind farms and continuing the trend of the 18% year-over-year increase in renewables in the first half.
S&P Global Commodity Insights' analysis of 20-year average 100-meter wind speed data from the European Centre for Medium Range Weather Forecasts shows that wind speeds across every state with current operational capacity in the contiguous U.S. have increased between the second quarter of 2000 and the second quarter of 2022. The exact magnitude varies across the U.S., with values as low as 0.7% in South Dakota and as high as 6.4% in Utah. The largest increases congregate over the Western U.S. and the far Northeastern U.S. The smallest increases, based on data available as of this writing, are found in the Upper Midwest, showing less than 1% growth in average wind speed over the last 22 years.
States with more operational capacity are found in the Great Plains and Upper Midwest, stretching from Texas with 36.5 GW to North Dakota with 4.3 GW and to Michigan with 3.2 GW as of the second quarter. Texas boasts the largest capacity of wind farms, with Iowa a distant second with 12.2 GW. Generally, the U.S. Southeast and Northeast have fewer wind farms due to nonexistent or light renewable portfolio standards, expensive land development and modest wind conditions.
Average 100-meter wind speeds over the 22-year period are highest over the Great Plains, followed by the Great Lakes region, mirroring the current capacity map, with the largest increases in wind speeds in the Western U.S. and Northeast. Rhode Island occupies the top spot with an average wind speed of 8.9 meters per second. A Nature Climate Change study published in December 2019 found that the general increase in North American wind speeds began in 2010, induced by the positive phase of the Pacific Decadal Oscillation. This natural regional climate cycle in its positive phase strengthens the prevailing westerly winds over the U.S. and can last for decades, countering the reduction in wind speeds that began in the 1970s. With the largest increases in wind speeds in the Western U.S. and Northeast, wind farms in these regions should expect a corresponding increase in power generation and a 3% increase in capacity factor over the next decade.
California, with current total capacity from wind turbines at 6.6 GW, has an average wind speed just above the 4-meters-per-second cut-in speed of a Vestas V164-8.0 wind turbine, with an increase of 4.2% over the last 22 years. The wind speed increased by 0.2 meters per second, from 4.1 to 4.3 meters per second in the interval. This equates to an increase in power output of about 12%. Wyoming, with a significant average wind speed of 7.2 meters per second, can also boast with a 5.3% increase in wind speed since 2000. That equates to an increase in power output of almost 13%.
Between 2000 and 2022, wind speeds in New Mexico and Wyoming had enough growth to displace South Dakota and North Dakota, respectively, states with comparable average wind speeds but less than 1% growth. This is also the case for Oklahoma and New Jersey, which moved up in ranking, displacing Iowa and Michigan, respectively. Generally, companies with wind farms in the Great Plains should continue to see plants in the southern part of the Great Plains outperforming those further north.
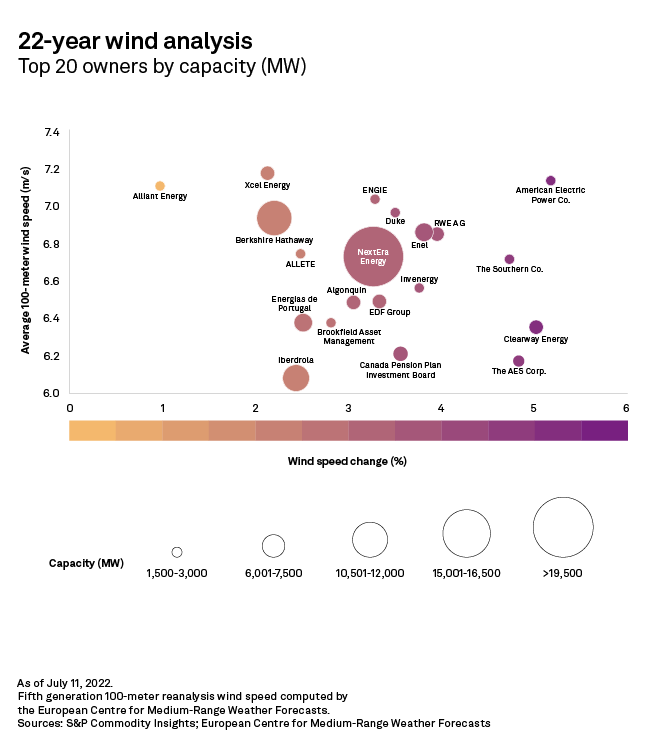
Of the top 20 companies by capacity, American Electric Power Co. Inc. gained the most from local increases in the climatological wind speed, placing it in an ideal position with a 5.2% change in wind speed and a healthy average wind speed. Southern Co. and Clearway Energy Inc. are close seconds with 4.7% and 5.0% growth, respectively, and comparable average wind speeds.
NextEra Energy Inc., with the most operating capacity, sits near the middle since most of its capacity resides in the Great Plains and states along the west coast where neither average wind speed nor average percent increase is large. Berkshire Hathaway Inc., with 11.3 GW of capacity, can boast a higher average wind speed but a lower percentage change due to a little over half of its capacity in Iowa.
Wind farm developers and investors have applauded the end of the boom-and-bust cycle of investment due to the recent passage of the Inflation Reduction Act, giving a boost to the wind sector. The expected 10-plus years of tax credits could incentivize wind farm development outside states with the highest average wind speeds toward states with larger expected growth over the same time period.
Regulatory Research Associates is a group within S&P Global Commodity Insights.
This article was published by S&P Global Market Intelligence and not by S&P Global Ratings, which is a separately managed division of S&P Global.