Introduction
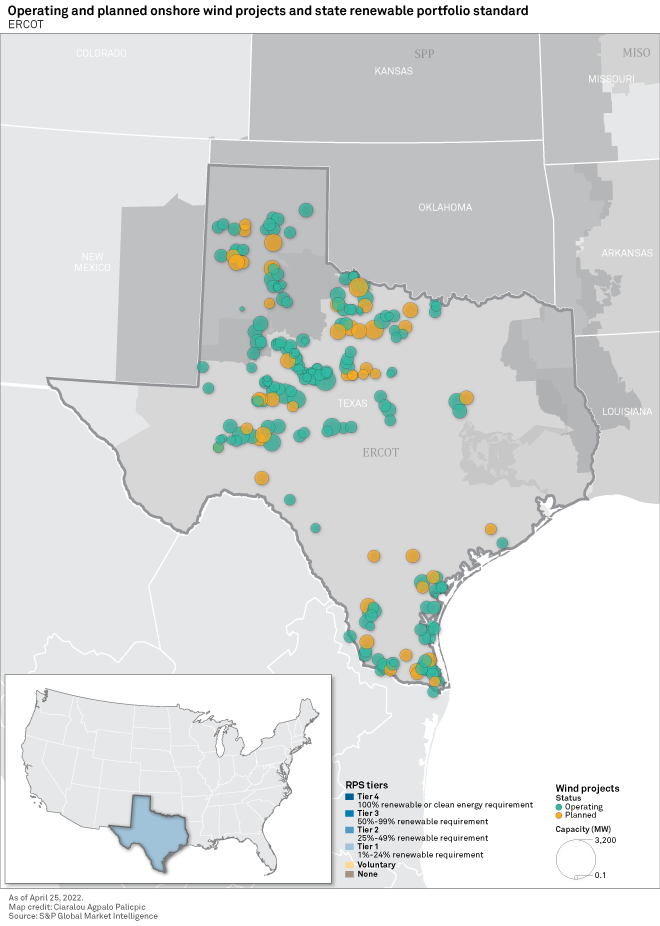
Encompassing virtually all of Texas, the Electric Reliability Council Of Texas Inc. is at the vanguard of the U.S. renewables revolution, thanks, in part, to the Lone Star State's sizable onshore wind portfolio — the largest in the nation with a 25% share of the U.S. operating total. Texas's strategic shift toward solar, however, is putting a damper on ERCOT wind development. As a result, ERCOT's wind pipeline is the fourth largest among the five designated zones in the S&P Global Commodity Insights wind investment outlook, edging out only the Northeastern U.S.

ERCOT manages 90% of the electric load in Texas, which is characterized by physical attributes conducive to robust wind development, namely windiness and abundant, relatively affordable open space.
Home to some of the largest wind projects in the nation and accounting for more than a quarter of overall operating U.S. wind capacity, the region lives up to its reputation as the land where everything is bigger, including planned renewable capacity.
Though still heavily reliant on fossil fuels, Texas is looking at the largest amount of planned wind capacity in the nation, and the state has an even larger solar pipeline after years where photovoltaic was an afterthought.

Bordering Mexico, the region spans some of the southernmost contiguous U.S. latitudes, featuring abundant sun and wind. Texas has the second-largest U.S. population, behind California, but it is the largest continental U.S. state by landmass, with an area exceeding that of Western Europe's economic engines, France and Germany. Its population, however, is less than half that of France and Germany, with a moderate population density of about 114 households per square mile, slightly above the national average of 94 households/square mile. Furthermore, most of the state's population is concentrated in a handful of large metropolitan centers, leaving large areas of undeveloped land ripe for utility-scale renewable development.
Combined with a generally enticing fiscal environment, the state's optimal solar and wind conditions and vast, relatively inexpensive tracts of land — Texas is known for its Great Plains — make Texas a hotbed for renewable energy development. Fully capitalizing on this environment, Texas eclipsed its renewable portfolio standard target of 10 GW of renewable capacity years in advance of its 2025 goal, thanks largely to its super-sized wind portfolio.
As a deregulated market, the state appeals to corporate off-takers. Texas accounted for about a third of the corporate renewable energy deals tracked by Commodity Insights in early 2022, with wind comprising over 54% of the tracked corporate-tied capacity in the state. Dallas-headquartered telecommunications giant AT&T Inc. had 1.3 GW of contracted renewable capacity in Texas as of our Feb. 25 corporate renewables roundup, including 800 MW of wind, making it the largest renewable corporate off-taker in the state. AT&T notably contracts all the capacity of NextEra Energy Inc. subsidiary ESI Energy LLC's 300-MW Javelina III (Torrecillas) Wind Energy Project near the Lower Rio Grande Valley.
Despite Texas's popular association with and continuing reliance on the oil and gas industries, the state ranks as the U.S. wind energy front-runner by volume. Texas operates more than 36 GW through some of the nation's largest wind farms, including NextEra Energy Resources LLC's 736-MW Horse Hollow Wind Energy Center and 663-MW Capricorn Ridge Wind as well as the 525-MW Aviator Wind Project (Grape Creek), co-owned by CMS Enterprises Co., KPIC USA LLC and Ares Infrastructure and Power Group.
Texas led the nation in wind energy generation in 2020, producing more than 27% of the U.S. total — 17 percentage points ahead of number two Iowa, which produced 10% of the nation's wind generation. Yet, wind trailed fossil fuels markedly in Texas's generation mix, with wind projects averaging a 37% wind capacity factor and producing only 19.5% of the state's 2020 electricity generation, versus 52.1% for natural gas and 16.8% for coal. In comparison, Iowa derived more than 57% of its overall energy output from wind.

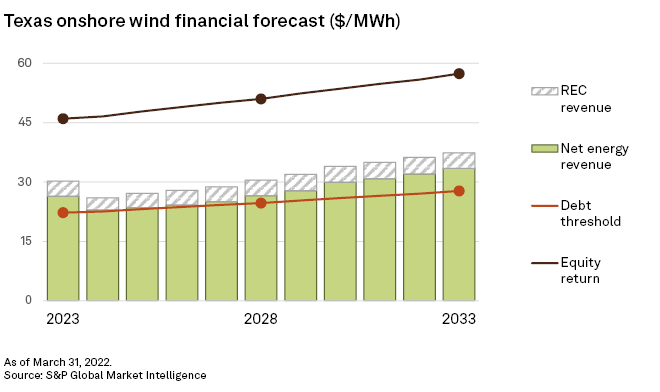
Texas wind economics are increasingly competitive for new projects, according to the S&P Market Intelligence power forecast. Net energy revenues range from $22.27/MWh to $27.76/MWh from 2023 through 2033, making a full equity return harder to achieve across the interval, even with the addition of Renewable Energy Credit, or REC, revenues. The REC market in Texas has often been viewed as a proxy for the voluntary REC market as energy providers in the state no longer need to comply with the surpassed renewable portfolio standard.
Looking forward, Texas has a noteworthy 15-plus GW of planned onshore wind capacity in the works, but the state is taking a hard turn toward photovoltaic generation, with a utility-scale solar pipeline dwarfing planned wind by nearly 4-to-1. For perspective, The West leads our wind investment outlook's designated regions in planned wind capacity, with 27 GW in the pipeline. After years of wind capacity leadership, ERCOT could fall to fourth place based on combined operating and planned wind capacity levels as of this writing.

Regulatory Research Associates is a group within S&P Global Commodity Insights.
S&P Global Commodity Insights produces content for distribution on S&P Capital IQ Pro.
Adam Wilson, Kristin Larson, Chris Allen Villanueva and Ciaralou Palicpic contributed to this article.
This article was published by S&P Global Market Intelligence and not by S&P Global Ratings, which is a separately managed division of S&P Global.


