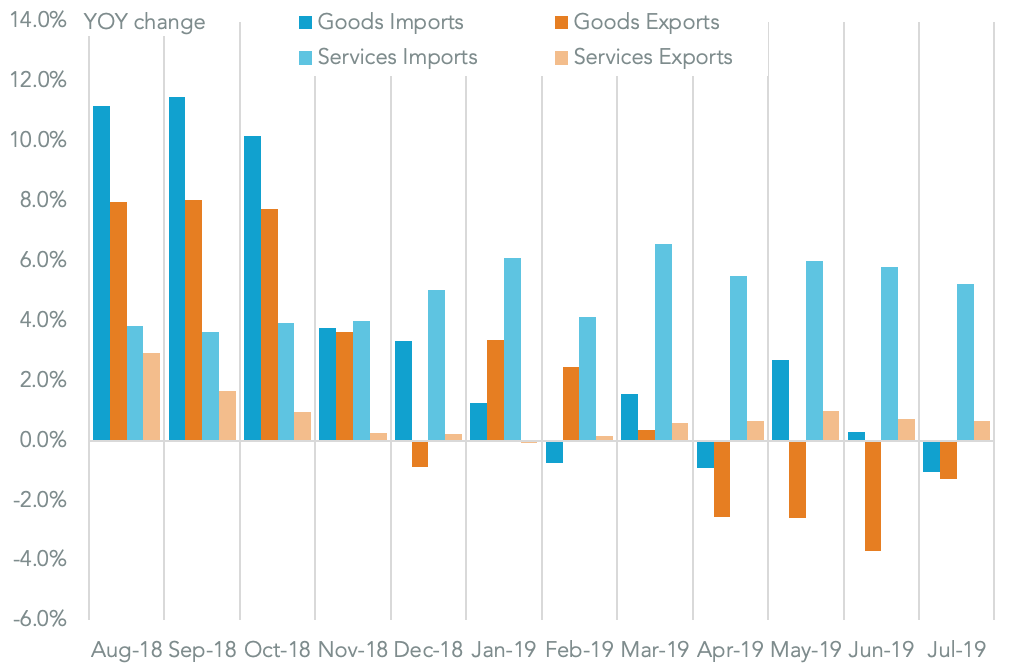
U.S. international trade activity fell 0.2% year over year in July, Panjiva’s analysis of official data shows. That marks the second monthly decline in activity with exports of goods falling 1.3% year over year and imports down 1.1%. The latter was linked to increasing tariffs on Chinese exports, as outlined in Panjiva’s research of Aug. 29. The resulting trade-in-goods deficit of $73.7 billion was therefore down from $74.1 billion.
Yet, that was offset by a drop in the services trade surplus to $19.7 billion from $21.7 billion a year earlier after export growth of just 0.7% was offset by a 5.2% rise in imports.
In aggregate the resulting trade deficit of $53.9 billion compares to $52.4 billion a year earlier and was the largest for the month of July since 2008.
TARIFFS BITE INTO TARIFFS, RELATIONS MAY BE HURTING SERVICES

Chart shows year over year change in U.S. trade by direction and type. Calculations based on U.S. Census Bureau data. Source: Panjiva
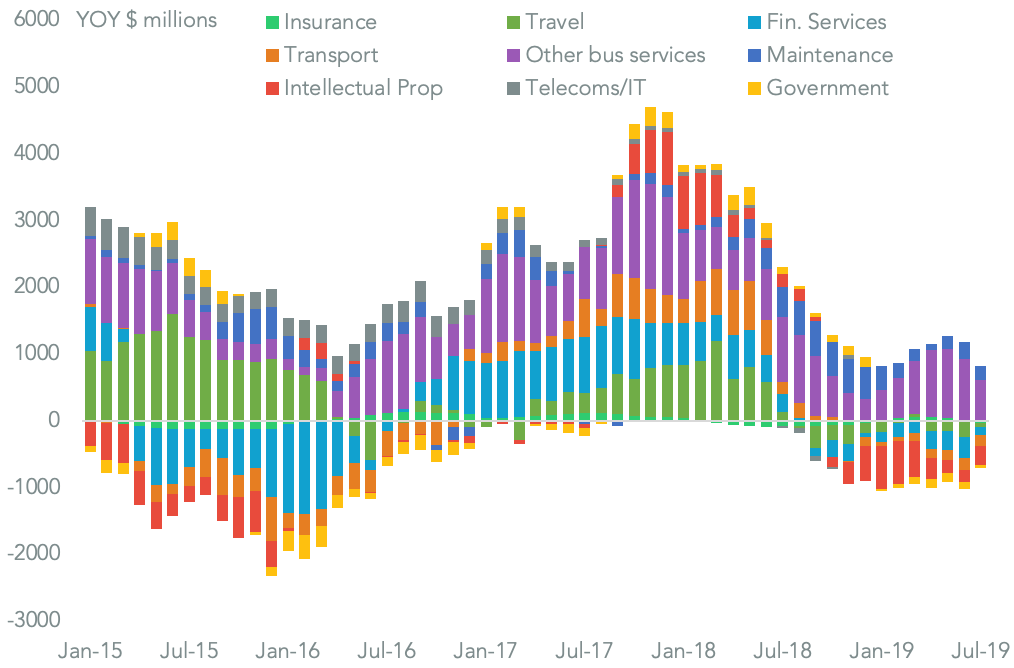
The slowing services export growth rate was partly down to a contraction in insurance, intellectual property (including media), travel and transport. The latter fell by 0.4% and 2.0% respectively, continuing an eight month trend that may be linked to the deteriorating relations between the U.S. and China.
AMERICAN IDEAS, TRAVEL AND TRANSPORT FALLING OUT OF FAVOR

Chart segments dollar value of year over year change in U.S. services exports by industry. Calculations based on U.S. Census Bureau data. Source: Panjiva
One year on from the initial implementation of U.S. duties on Chinese exports tariffs have continued to take a toll. That’s largely due to the widening scope and depth of tariffs – the July figures include an increase in duties to 25% from 10% on imports of so-called “list three” products.
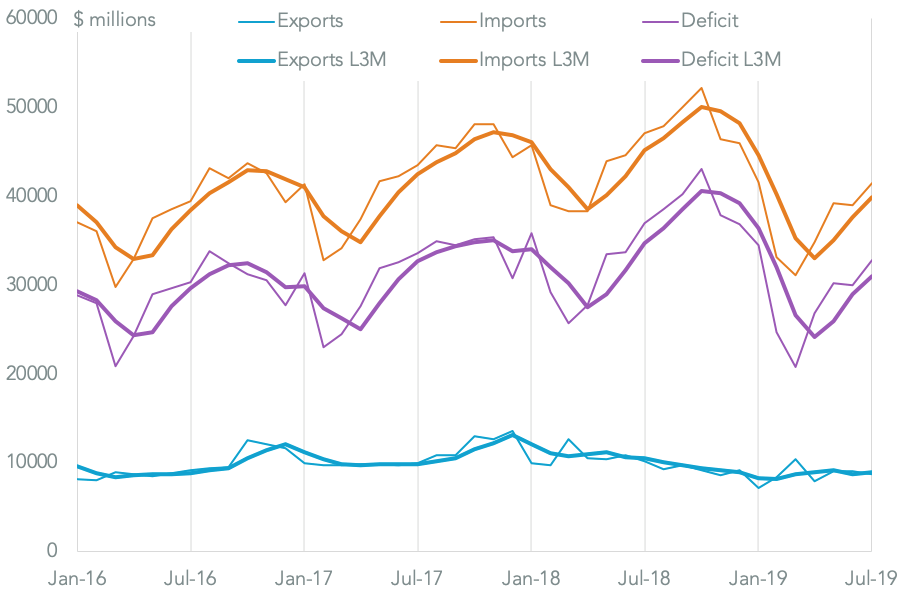
Total merchandise trade with China fell 12.2% year over year, marking the ninth straight decline. Exports to China fell 13.8%, with imports down slightly less at 11.9% suggesting the U.S. “lost” the latest round of the trade war. However, the change in exports in dollar terms was lower at $1.40 billion versus a $5.61 billion drop in imports.
TARIFFS TAKE TOLL ON TRADE WITH CHINA

Chart segments U.S. trade in goods with China by direction on a monthly and three-month average basis. Calculations based on U.S. Census Bureau data. Source: Panjiva
That led the trade deficit with China to drop 11.4% year over year to $32.8 billion, consistent with “success” on the basis of the Trump administration’s preferred trade metric.
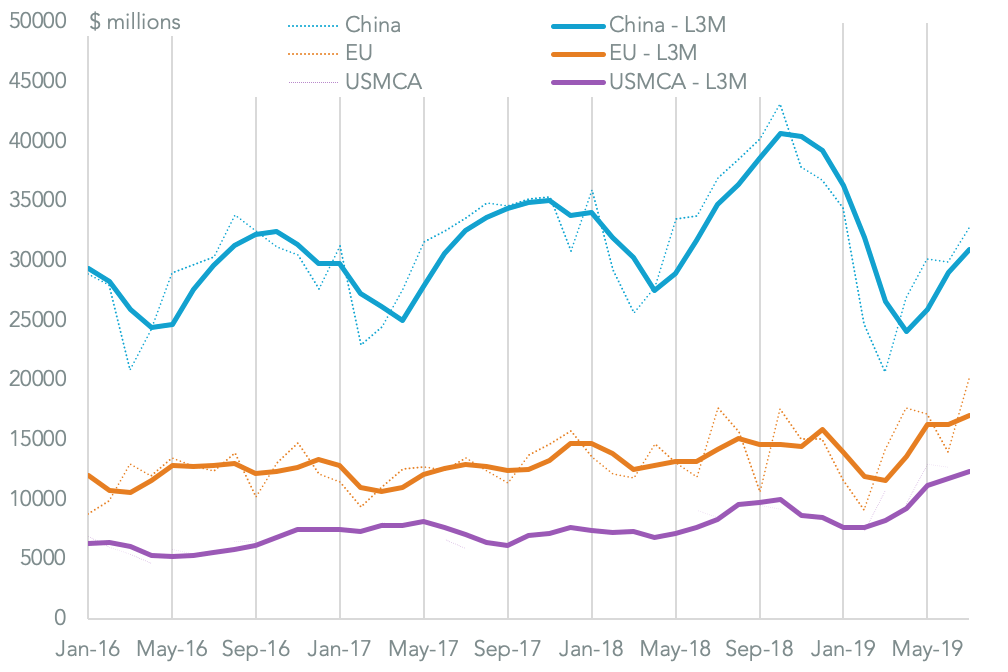
The bigger challenge for the administration – from a trade deficit perspective – are relations with the EU where the trade surplus climbed 13.8% year over year to a record $20.1 billion in July. That increases the likelihood that trade relations deteriorate rather than improve in the next few months. Indeed President Trump has already stated that the EU is “worse than China” in terms of applying “barriers, tariffs, taxes”.
EUROPE AND USMCA DEFICIT RISING AS TRADE WITH CHINA WANES

Chart segments U.S. trade in goods deficit by counterparty on a monthly and three-month average basis. Calculations based on U.S. Census Bureau data. Source: Panjiva


