Introduction
The pipeline for solar in the U.S. has exploded to nearly 187 GW, with renewable powerhouse Texas leading the way. Most of the remaining states in the top 10 by solar generation output — such as California, Nevada and Arizona — feature some combination of aggressive renewable portfolio standards and excellent solar resources. The Rust Belt states of fourth-ranked Ohio and seventh-ranked Indiana are apparent outliers, as neither state has ambitious renewable targets or the abundant sunshine of the desert southwest. Despite this, Ohio and Indiana have a combined 18 GW of solar in development, seven times their amount of wind capacity in planning. The neighboring states of Illinois, Michigan, Pennsylvania and Wisconsin are following suit, all having 2 GW or more of solar in development.

Despite generally tepid renewable energy requirements, Rust Belt states, which include Illinois, Indiana, Michigan, Ohio, Pennsylvania and Wisconsin, have recorded increasingly ambitious solar pipelines totaling over 31 GW — more than three times the combined pipeline for wind. Led by Ohio, which has the fourth-highest planned solar capacity in the country, and Indiana, which has the seventh-highest planned solar capacity, these Rust Belt states are seemingly outliers among the top 10 states for solar development due to their lack of aggressive renewable portfolio standards and unimpressive solar resources.
Thanks to increasing corporate renewable interest, barriers for wind development and over 27 GW of coal capacity scheduled to go offline over the next decade, solar developers have flocked to the Rust Belt looking to capitalize on the potentially lucrative solar market. According to S&P Global Commodity Insights analysis, solar resources in the region are sufficient for favorable financial returns for new solar projects over the next decade.

Development outpaces legislation
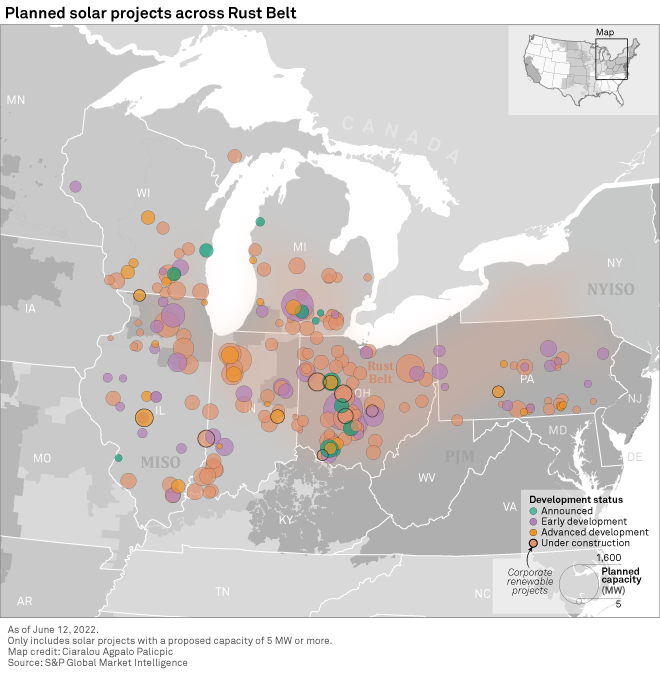
The six-state stretch that includes the Midcontinent ISO and PJM Interconnection LLC states of Illinois, Indiana, Michigan, Ohio, Pennsylvania and Wisconsin comprises, for lack of a better geographic designation, the Rust Belt region. The region covers these states as well as portions of New York and West Virginia, with its moniker referring to its once-prosperous industrial development, hit hard by the deindustrialization and economic decline of the 1970s and 1980s. Now, these six states have emerged as hubs for forward-looking solar development, with more than 31 GW of solar in planning. Adding New York would push this total to over 40 GW. New York is largely excluded from this analysis, however, as aggressive targets of 70% renewable by 2030 and 6 GW of solar by 2025 easily explain the state's strong solar pipeline.
Ohio and Indiana do not have this level of legislative support for solar. Ohio became one of the few states to reduce its renewable portfolio standards, or RPS, in 2019, lowering the final target from 12.5% to a measly 8.5% by 2026. Indiana has a voluntary target of 10% clean energy by 2025, although portions of this target may be met with "clean coal" technology as well as natural gas generation that displaces coal generation. This is a nonbinding target, but utilities that comply are eligible for incentives. Yet, despite these lackluster state renewable policies, Ohio ranks fourth in the country with 11.4 GW of solar capacity in development, and Indiana ranks seventh with 6.6 GW in planning.
Other Rust Belt states have similarly low renewable requirements. Pennsylvania's renewable requirements maxed at 18% in 2021. Michigan also leveled out in 2021 at 15%, while Wisconsin reached its current target of 10% back in 2015. Illinois is the exception: It passed the Climate and Equitable jobs Act in 2021, raising its renewable commitments to 40% by 2030 and 50% by 2040.

Installed solar capacity across the Rust Belt remains relatively low. Illinois leads the region with 639 MW in operation. Combined, the six states have just short of 3 GW of solar currently operating — less than one-tenth of what is in the pipeline. The region has just eight solar projects with an operating capacity of 100 MW or more, and all were commissioned in the last two years. Among the largest are Ohio's 200 MW Hillcrest Solar Project, owned by Innergex Renewable Energy Inc. and Indiana's 200 MW Riverstart Solar Park, operated by EDP Renewables North America LLC.
In development, Ohio has 57 projects in planning, 46 of which are 100 MW or more. The largest project in planning is the 1.6 GW Oak Run Solar Project developed by Shell PLC subsidiary Savion LLC. Savion is one of the more active developers in the Rust Belt region, with seven projects in planning totaling 2.4 GW. Of the 11.4 GW of solar planning in Ohio, 9.9 GW are still in early development or announced stages.
Indiana has 37 proposed solar projects, and 31 have a planned capacity of 100 MW or more. Notable projects include the 760 MW Mammoth Solar Project developed by Doral Renewables LLC and the combined 700 MW Dunns Bridge Solar I and Dunns Bridge Solar II projects developed by NextEra Energy Inc. Over 90% of the solar capacity planned in Indiana is in early development or announced phases, but two large projects have begun construction — the 200-MW Indiana Crossroads Solar Park and the 152-MW Bellflower Solar Project jointly owned by BP PLC and Lightsource BP Renewable Energy Investments Ltd.
Illinois ranks third in the region and ninth in the country with 4.8 GW of solar in development, while Michigan is right behind, ranking tenth in the country with 3.8 GW of proposed solar capacity. Wisconsin and Pennsylvania have a respective 2.5 GW and 2.1 GW of solar in various stages of development. Wind development is steady but limited, outpaced by solar more than threefold in this six-state swath. Unlike in the Western U.S., energy storage has not quite followed the increased momentum for solar in the Rust Belt, with roughly 1.6 GW of storage — both collocated and stand-alone — in planning across the region.
Drivers of the solar boom
Unlike states such as Texas, California, Nevada and Arizona, which boast abundant sunshine, aggressive RPS targets, or both to explain their burgeoning solar pipelines, Rust Belt states lack formidable renewable policies. And while the region has generally adequate solar resources, they are far from world-class. That said, several drivers have prompted developers to home in on the Rust Belt for solar development.
Corporate renewables are a key force in the growing interest in solar across the region. Nearly 9 GW of renewable capacity are contracted to non-utility off-takers. Illinois and Ohio make up most of this capacity, ranking a respective second and third in corporate renewable capacity. Ohio has become a data center hub, which is helping to drive much of this corporate renewable interest, led primarily by Amazon.com Inc. and its more than 2.4 GW of renewables — mostly solar — under contract in the Buckeye state alone.
Looking forward, solar projects across the PJM and MISO regions are expected to produce average to excellent returns. Developers have noted that the region has enough solar resources to compete with traditional generation. According to Commodity Insights analysis, new solar projects in Indiana and Wisconsin are forecast to surpass debt service requirements over the next decade, while new solar projects in Ohio should achieve almost a full equity return over the period thanks to supplemental renewable energy credit revenue.
Solar has overtaken wind in development as well, thanks in part to the federal investment tax credit which runs through the end of 2023, whereas the production tax credit for wind expired at the end of 2021. Further, siting and setback rules in certain states have also hindered wind interest. Notably, Ohio has strict setback regulations, initially implemented in 2014. These restrictions set minimum wind turbine distances from property lines as well as increase the number of acres per turbine. The restrictions reduce the amount of land suitable for wind development and increase the land footprint of new wind projects, driving up costs and making the technology less economically attractive.

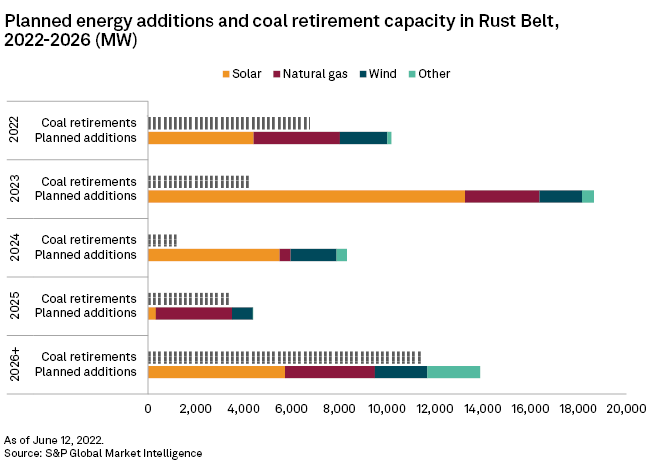
Perhaps the biggest driver for new solar is the increasing need to replace outgoing coal generation. According to S&P Global Market Intelligence data, over 27 GW of coal capacity is projected to retire by 2030 or sooner across these six Rust Belt states. Indiana leads with nearly 8.7 GW of coal on the chopping block, leaving a formidable void in generation. New natural gas plants are also in development, but competitive economics are allowing solar to step in and meet this demand as well. Michigan, Illinois and Ohio all have 5 GW or more coal capacity expected to retire over the next decade. Along with lucrative returns for solar, this outgoing capacity has made MISO one of the key markets to follow for new renewable development going forward.
The Rust Belt is a prime demonstration of how utility-scale solar has matured well beyond the need for substantial state-level legislative support or the consistent sunshine of the desert southwest. Thanks to increasing corporate renewable interest and fewer hurdles for development compared to wind, solar is expected to be a key technology to replace the significant amount of coal capacity retiring over the next eight to 10 years. Many projects remain in early development stages, so it is difficult to say how much of the 31 GW of Rust Belt solar capacity will make it online. Still, demand is there and the economics add up — at least for now.
Ciaralou Palicpic contributed to this article.
This article was published by S&P Global Market Intelligence and not by S&P Global Ratings, which is a separately managed division of S&P Global.


