
Introduction
S&P Global Commodity Insights reports on major gold acquisitions in 2020-2021, defined as transactions with a deal value of at least $10 million involving reserves of at least 1 million ounces of contained gold.

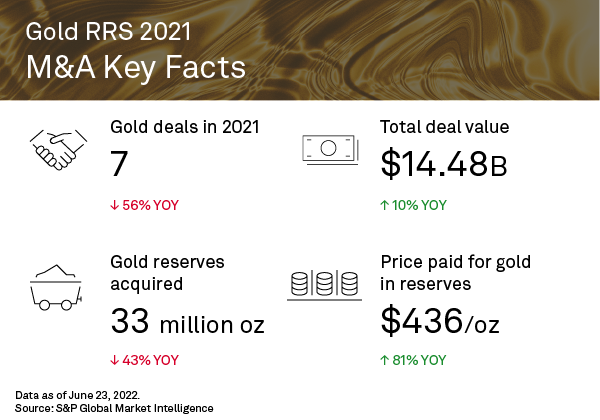
Gold M&A in 2021 was dominated by the $10.62 billion merger of equals between Canadian majors Agnico Eagle Mines Ltd. and Kirkland Lake Gold Ltd., a high-profile transaction that topped Newmont Corp.'s 2019 acquisition of Goldcorp Inc. and signaled an ongoing trend of industry consolidation. The total deal value was up and the acquired gold was down year over year in 2021. A strong market price drove the price paid for gold reserves during the year to a decade high of $436 per ounce.
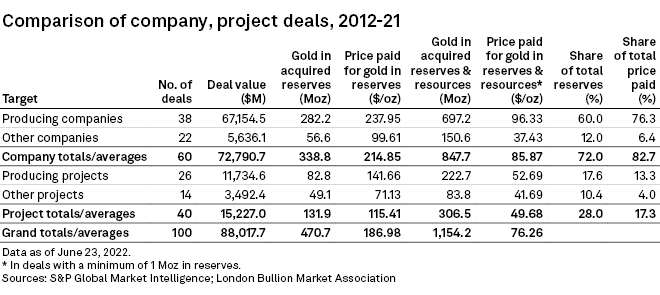
Companies with established production, rather than projects still in development, have been increasingly favored as targets over the past four years as large producers look to expand their geographical footprint around proven and operating assets, and smaller miners add production to take advantage of the high-price environment. The majors have unsurprisingly been the most active group of buyers, engaging in the most deals with the highest deal values. A shrinking list of available assets, however, coupled with depleting reserves, will shape the M&A landscape in the coming years and have a strong influence on the price paid per ounce of gold acquired.

In 2020-21, there were 23 gold transactions with a total value of $27.62 billion, involving 91.5 Moz of metal in reserves and 223.6 Moz in reserves and resources. As in 2018-19, producing assets were the focus of gold M&A activity, comprising 70% of all company and project purchases. In dollar terms, these producing assets were valued at $26.44 billion, or 96% of the total transaction value for the two-year period, and they accounted for 76% and 86% of the total gold acquired in reserves and in reserves and resources, respectively.
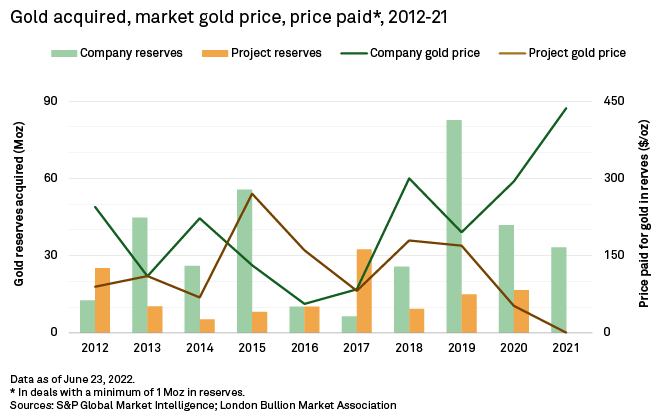
Price paid for gold at decade high on $1,800/oz market price in 2021
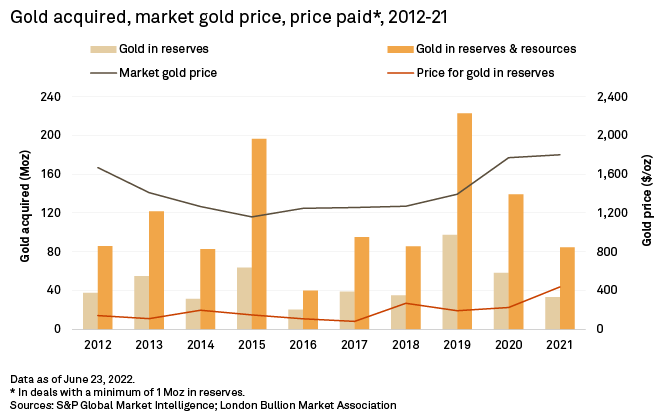
Going into 2020, the number of gold deals ticked up year over year by four, to 16, marking the high point of the last 10 years. The transaction value was 30% lower, however, while the amount of metal acquired dropped 40%. Meanwhile, on account of the market disruptions caused by the onset of the COVID-19 pandemic in early 2020, the gold price significantly increased, reflecting the safe-haven status of the yellow metal. With the market price averaging $1,771/oz, nearly 30% higher than in 2019, the prices paid per ounce of gold acquired in reserves and in reserves and resources increased, although they were still lower than the 2018 peaks.
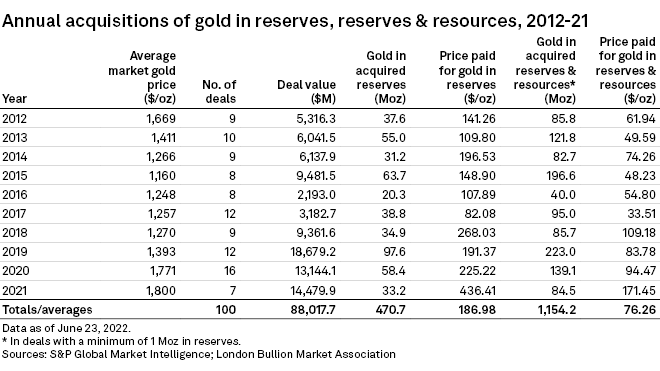
In 2021, although the number of deals more than halved year over year, the total deal value increased 10%, resulting in an average deal value of more than $2.0 billion, a 10-year high. The amount of gold acquired dropped below the 2012-21 deal average, so that as the market price settled at an annual average of $1,800/oz in 2021, the price paid for gold in the year's transactions reached a period high. The price for gold in reserves went up 94% year over year and up 81% for the total metal in reserves and resources.
Industry consolidation accelerates
The acquisitions trend over the decade showed a simultaneous decline in project acquisition and a significant rise in company takeovers as well as an emphasis on producing assets. Large producers have been buying out smaller companies operating around single assets, looking to expand production at developed sites and, in some cases, paying a premium for the contained metal.
The amount of gold transacted decreased from the 2019 high, however, dropping 66% in 2021, although there were two similar major-major company deals. Despite Agnico Eagle Mines' takeover of Kirkland Lake topping the Newmont-Goldcorp deal value, much less gold changed hands. In its deal announced in the September quarter of 2021, Agnico Eagle Mines only obtained 38% and 44% of the gold in reserves and in reserves and resources acquired by Newmont, at 20.2 Moz and 57.5 Moz, respectively.
In the second-largest transaction of 2020-21, announced in the December 2020 quarter, 18.2 Moz of gold in reserves and resources changed hands for $4.49 billion when Northern Star Resources Ltd., a major based in Perth, Australia, acquired local company Saracen Mineral Holdings Ltd. through a merger of equals.
Of the 23 acquisitions in 2020-21, only three were for projects — two producing and one nonproducing. All three were transacted in 2020, further indicating the industry shift toward consolidation in 2021.
Thin pipeline drives high price paid per ounce
Despite healthy gold exploration budgets resulting in a recent increase in major gold discoveries, about half of the gold was added to deposits discovered 20 years ago, with the bulk of that increase at operating assets, their expanded reserves and resources making them the main deal targets. The number of such new, high-quality discoveries will not be enough to support the long-term pipeline, however, with global gold production expected to stagnate in the near term and decline before the end of the decade. A thinning project pipeline and diminishing reserves will likely sustain the high valuation of operating companies and the high price paid per ounce of gold transacted.
Roxgold Inc. commanded the highest price paid per ounce in the past two years, when Fortuna Silver Mines Inc. acquired its 2.2 Moz of gold in reserves and resources for $866.4 million, or $402/oz, in the first half of 2021. In this transaction, Fortuna paid almost four times the average price and 30% more than the second-highest price per ounce of $291/oz paid by Denver-based SSR Mining Inc. in its merger of equals with Alacer Gold Corp. for 6.4 Moz of gold. The new Fortuna is now considered a low-cost intermediate producer, with a permitted development project that would allow for production growth in the near term.
Strong gold financing and exploration over the past two years, however, might somewhat reverse this trend in the latter half of the decade as nonproducing yet attractive targets are identified.
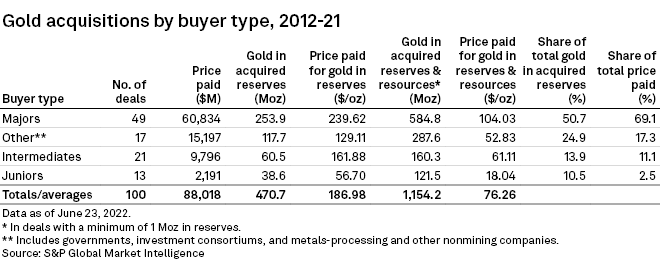
Majors still dominate M&A
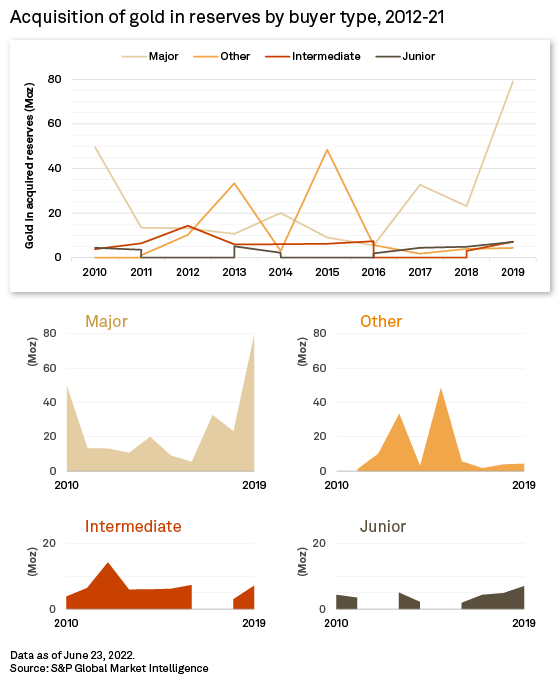
With nearly half the number of deals between 2012 and 2021 and 70% of the deal value, the majors have dominated gold M&A. The group accounted for at least 38% of the number of deals each year, reaching 67% in 2017 with eight acquisitions. Moreover, they also raised their share in dollar terms — often in recent years in a single high-profile transaction. Agnico Eagle Mines' purchase of Kirkland Lake in 2021 accounted for 93% of the year's deal value, while Newmont's acquisition of Goldcorp two years prior accounted for 87% of the total transaction amount. With few exceptions, these trends have translated into the majors also acquiring more than half of the transacted gold in reserves over the past decade.
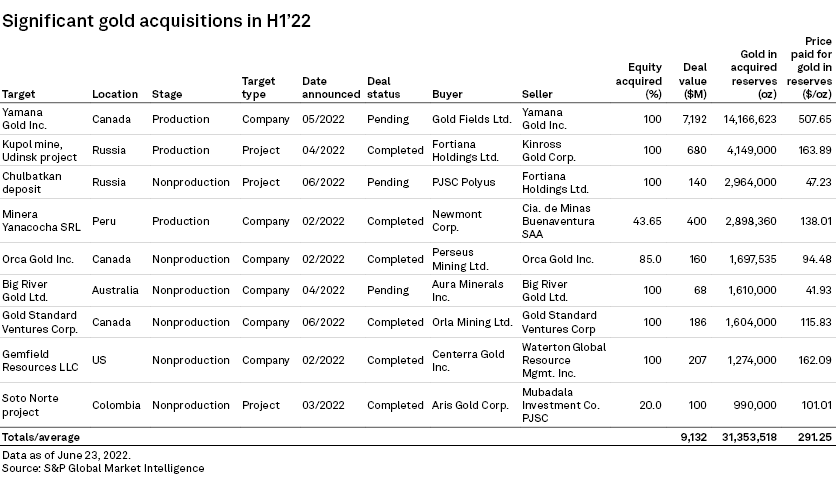
How is 2022 shaping up?
M&A in the first half of 2022 looks to continue the trends of the previous two years. A major-major takeover, South Africa-based Gold Fields Ltd.'s pending acquisition of Canadian Yamana Gold Inc., accounts for 79% of the $9.13 billion total value for the period. With 14.2 Moz of gold in reserves, the price paid would be the highest so far — unsurprising, given the average market gold price of $1,875/oz in the first half of the year. Although companies are still the favored targets, the focus has shifted to nonproducing assets, which make up two-thirds of the deals. The amount of gold acquired in reserves, however, is already just shy of the total acquired in full year 2021.
Of the 31.4 Moz of acquired gold in reserves, a mere 9% comes from the nonproducing targets despite transactions involving these assets amounting to 67% of the total deal value. In what could be the start of a trend reversal, this shift in focus indicates a willingness to invest in development-stage projects based on reserves potential rather than immediately accretive production — likely on the back of strong exploration and financing over the past two years.
This article was published by S&P Global Market Intelligence and not by S&P Global Ratings, which is a separately managed division of S&P Global.