
Introduction
With supply chains being disrupted by the ongoing COVID-19 pandemic and the conflict in Ukraine, miners are being hit with growing minesite costs as inflation takes hold. This article dives into the key cost-inflation factors affecting the gold industry looking out to 2026. The largest cost increase is for fuel globally, with other costs remaining relatively flat for 2022.

* Fuel prices are driving cost inflation at mine sites from 2022 onward.
* Inflation's impact is lessened by a strengthening U.S. dollar, reducing costs when converted from local currency.
* The largest gold producers skew regional costs downward due to economies of scale.
* Gold production is forecast to peak in 2024 at 64.7 million ounces, reducing cost-inflation impact on a dollars-per-ounce basis.

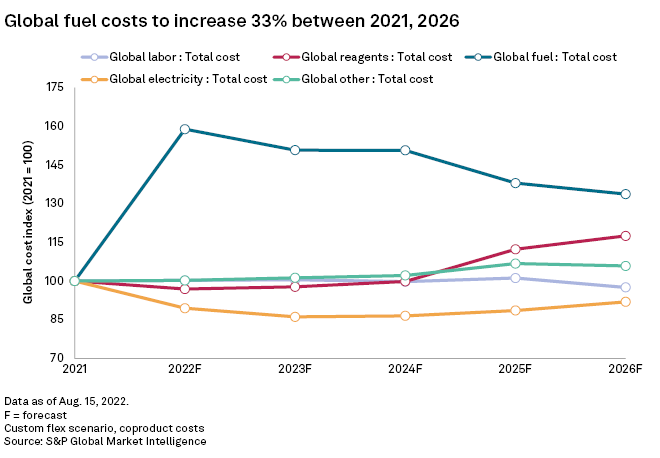
Using a custom flex scenario of consensus forecasts, we estimate the global total minesite cost, on a $/oz coproduct basis, will increase 4% in 2022 and remain relatively flat for the forecast period to 2026. Using an index starting in 2021, the main cost driver is fuel, increasing $44/oz in 2022 and growing 22% between 2021 and 2024 to $91/oz in 2024. The causes of the rises are high global fuel prices in the wake of the Russian invasion of Ukraine in February. International sanctions on the sale of Russian oil increased the Brent Crude Index 21.21% in the year to Aug. 16, raising fuel prices globally. With most of the large gold-producing mines being open pits, they are the most sensitive to fuel-price increases because of their diesel-powered haul trucks and excavators. Although the fuel cost is estimated to increase substantially in 2022, in terms of overall proportion of total minesite cost, it will be the third-highest minesite cost factor between 2022 and 2026 at an average 13% of total minesite cost. Labor and "Other" costs account for 70% of total minesite cost and are forecast to remain relatively static on a $/oz basis over the forecast period.
Although global gold production is expected to increase approximately 4 Moz year over year in 2022 for the assets covered by the Mine Economics product, and thereby reduce costs per ounce, electricity costs will fall by $266 million between 2021 and 2022. As many mines have long-term electricity purchase deals or control their own power plants, they are more insulated from higher wholesale electricity prices as tariffs are negotiated years in advance. Another factor assisting the lower costs is the increasing usage of renewable energy at mine sites, reducing reliance on fossil-fueled generators. For example, BHP Group Ltd. is building a 71,000-solar panel array at its Leinster and Mt Keith nickel mines in Australia, replacing the current gas- and diesel-powered generators.
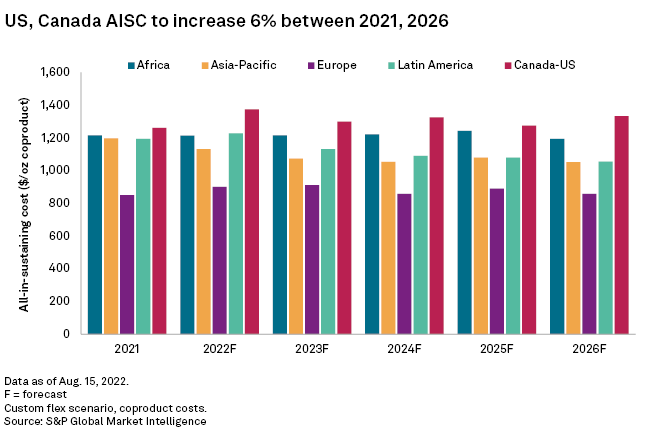
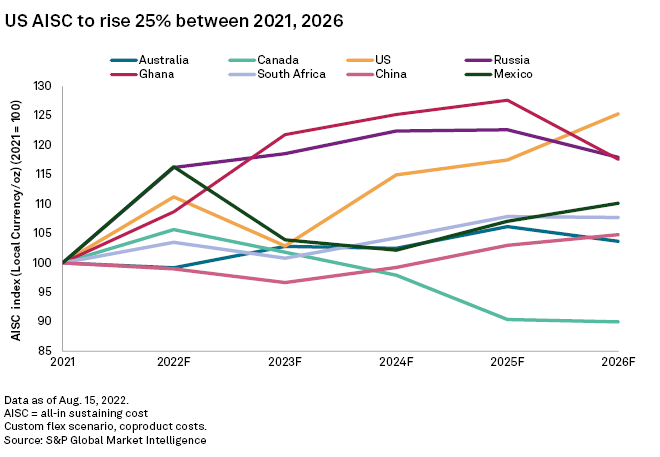
Looking at all-in sustaining costs, or AISC, on a regional basis, Canada-U.S. is expected to continue as the highest-cost region with AISC peaking at $1,373/oz in 2022. The main driver, as previously discussed, is a 64% increase in fuel cost. The Canada-U.S. labor cost is also expected to rise by 9% as wages increase in 2022 to counter inflation. As of July 2022, the U.S. consumer price index is forecast at 7.5% in 2022, falling to 3.41% in 2023. Another driver is the strengthening U.S. dollar reducing U.S. operations' competitiveness when ex-U.S. mine figures are converted to U.S. dollars. As Canada is closely aligned with the U.S. economically, the same factors apply, although Canadian dollar weakness helps lower the Canada-U.S. AISC slightly.
Europe has the lowest AISC for the forecast period, peaking in 2023 at $901/oz. The region contains mines in Russia and Former Soviet Union countries, including the world's second-largest gold-producing mine, Muruntau in Uzbekistan. This mine is very low cost, with AISC averaging $647/oz between 2022 and 2026 due to economies of scale, with nearly 3 Moz per year of gold production forecast between 2022 and 2026. In addition, Uzbekistan has low labor and material costs, which further reduces costs on a $/oz basis. The large operation accounts for 26%-28% of Europe's gold production and of the region's average AISC.
Russia's currency has been devalued since the country annexed Crimea in 2014, leading to Russian gold mines being some of the lowest-cost gold mines for multiple years. With the conflict in Ukraine starting in February, Russia has been subject to multiple international sanctions affecting its ability to import supplies and equipment for the mining industry. This has led to local price inflation, with AISC in rubles/oz forecast to grow 16% in 2022, increasing to 1,023 rubles/oz in 2023. Russia will also produce over 45% of Europe's gold in 2022, countering Muruntau's low cost.
With costs increasing for energy and materials across all sectors globally, gold miners will need to factor in a higher-cost future for their operations. Economies of scale and adoption of new technology will be key for companies to control costs and maintain margins. If gold prices remain buoyant, the short-term pain from high fuel costs can be absorbed by most gold miners.
This article was published by S&P Global Market Intelligence and not by S&P Global Ratings, which is a separately managed division of S&P Global.