
Introduction
All top 20 wind portfolio owners in the U.S. and Canada experienced better-than-average wind speeds in the second quarter of 2022, according to an analysis of 100-meter hourly wind speed data, with deviations ranging from 4.8% to 12.3%. The performance builds on similarly positive first-quarter wind speed deviations for the top 20 wind portfolio owners.

One-hundred-meter average wind speeds were notably higher than normal in the second quarter of 2022 across the contiguous U.S., with deviations ranging from 4.8% to 12.3%. This continues the trend seen in the first quarter of strong wind speeds across much of the country. These stronger winds likely contributed to higher curtailment rates seen in the California ISO.
Among the top wind owners, Xcel Energy's wind portfolio experienced the highest deviation of second-quarter average wind speeds at 10.9%. NextEra Energy's nation-leading portfolio of nearly 21 GW saw wind deviations of 9.5% above normal. Previously, NextEra had attributed a one-cent increase in earnings per share in part to a 1% increase in average wind production. ALLETE Inc. led all midsized wind owners, with a portfolio that experienced average winds 12.3% higher than average.

The Southwest and Central regions had strong positive wind speed deviations in the second quarter of 2022. Nevada, North Dakota and Canadian province Manitoba all had deviations of more than 13% for the combined capacity of 4.7 GW in those states. Western and Central states Minnesota, Wyoming, Oklahoma, Colorado, South Dakota, Iowa and Nebraska logged wind speed deviations between 10% and 13%. These two groups of states encompass 34% of total U.S. wind capacity. More than 87% of U.S. wind capacity had a wind speed deviation of more than 5% in the second quarter. Alaska was the period's only U.S. state in negative territory during the period, down 6.6%.
Increased wind speeds generally correlate with increased generation at wind projects, though curtailment can decrease generation in windy conditions. California experienced wind speed deviations of 6.3% in the three months ended June 30, which may have contributed to the record amount of wind and solar curtailments in the California ISO during the first half of 2022.
Among the top 10 wind owners, Xcel Energy Inc. experienced the highest positive deviation, up 10.9%. Enel SpA's 5 GW of wind capacity came in a close second, with wind speeds 10.5% above the 20-year average. Berkshire Hathaway Inc.s 11 GW wind portfolio rounds out the top three, with an average 9.9% wind speed deviation. Operating the largest wind fleet at almost 21 GW, NextEra Energy Inc. recorded average wind speeds 9.5% above the norm. Previously, NextEra had attributed a 1% change in its internally calculated wind production index to a one-cent change in its earnings per share.
Xcel Energy's exceptionally windy portfolios peaked in April with an 18.8% deviation, topping the ranking for the group of top 20 companies. Xcel Energy's operating wind assets include more than 1 GW in both Colorado and Minnesota — states with wind speed deviations of more than 10%. Across the Xcel Energy portfolio, the 148 MW Border Winds Power Project logged the highest quarterly deviation, at 14.2%; the 522 MW Sagamore Wind Project in New Mexico logged the lowest, at 7.4%.
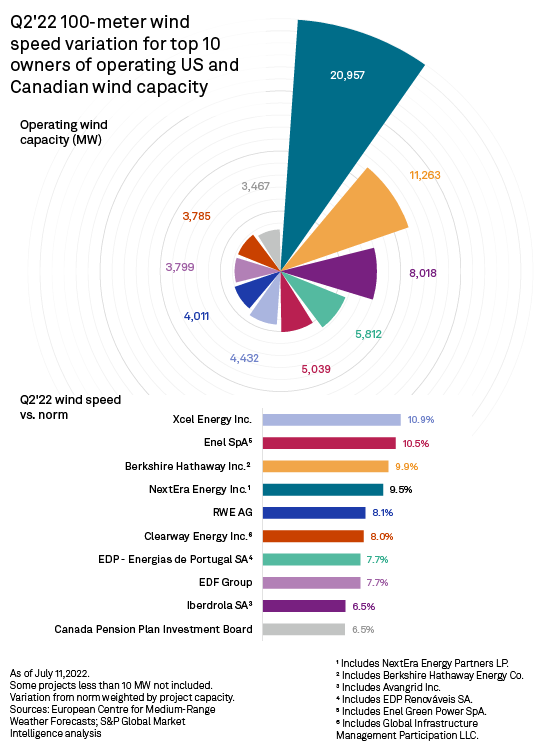
Enel owns about 10% of the wind capacity in Kansas, where wind speed deviations came in at 9.8%. Enel reported higher-than-average winds in North Dakota, Oklahoma and Minnesota, and a deviation of 9.5% in Missouri. North Dakota-based wind projects produced the Enel portfolio's largest positive deviations. The Lindahl Wind Project and the Aurora Wind Project had deviations of 14.7% and 13.9%, respectively. Like last quarter, only one Enel project, the 5 MW St. Lawrence Wind Project in Canada, had a deviation less than zero, at negative 6.2%.
Berkshire Hathaway owns the second-largest wind portfolio in the U.S. Its 33-plant portfolio in Iowa alone, totaling 7,080 MW, saw average winds ranging from 11% to 12% above normal. Contributing to Iowa's portfolio capacity increase is Berkshire Hathaway's Plymouth Wind Farm Project, with a variation of 12%. This variation is 4 percentage points higher than NextEra Energy Inc.'s Heartland Divide II Wind Farm, a similarly sized project also commissioned in 2022, with a capacity of 200 MW, in the state of Iowa. The company experienced positive wind speed deviations across all the states in which it operates wind capacity — from 0.7% in Oregon to 12% in Wyoming. About 63% of its Wyoming projects, commissioned from 1999 to 2021, had better-than-state average wind speeds, with variations from 13% to 14%.
Among 10 midsized wind operators, five companies experienced portfolio wind speed deviations greater than 9.5% in the second quarter. ALLETE Inc. tops the list at a deviation of 12.3% above average. ALLETE's largest projects, Caddo Wind Farm and Diamond Spring Wind Farm (Bergen Ranch), are both located in Oklahoma, a state where wind speeds vary by about that much. The Caddo Wind Farm even varies slightly higher than Oklahoma's state average. Its Bison Wind Energy Center projects, Bison 1 Wind Energy Center, Bison 3 Wind Energy Center and Bison 4 Wind Farm in North Dakota, feature the highest variation, with wind speeds 16% above normal. Its portfolio's five states have weighted averages of about 10% to 13% above normal.
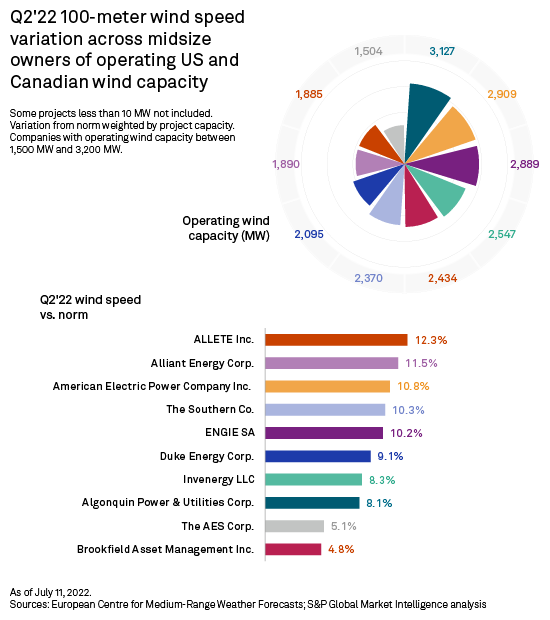
In terms of portfolio size, ALLETE and Alliant Energy Corp. portfolios are nearly identical, with ALLETE's portfolio totaling 1,885 MW and Alliant Energy Corp.'s portfolio totaling 1,890 MW. Alliant's overall portfolio wind speeds average 11.5% above normal. Alliant's highest wind speeds can be found at the company's 201.3 MW Minnesota-based Bent Tree Wind, varying 13.5% above normal, and the lowest wind speeds at the 68 MW Cedar Ridge Wind in Wisconsin, varying 8% above normal.
Among the top 20 company wind portfolios, NextEra Energy projects Oliver Wind Energy Center and Oliver Wind II in North Dakota had the highest positive wind speeds at 16% above normal. Another project within the above-16% range is Canada Pension Plan Investment Board's Hatchet Ridge Wind. Other below-average projects include Amherst Island Wind Project, Kittitas Valley Wind Power Project, Norway Wind Park, West Cape Wind Farm, Nicolas-Riou Wind and Meikle Wind Energy Project, with negative variations from the norm ranging from 2% to 5%.
S&P Global Market Intelligence electric quarterly report data shows that average fixed monthly transaction rates for some Iberdrola SA, NextEra Energy and EDF Group projects range from $14.4/MWh at NextEra Energy's Crowned Ridge Wind Energy Center Project I to $155.8/MWh at Invenergy LLC's Grand Ridge Wind Energy Center.
Regulatory Research Associates is a group within S&P Global Commodity Insights.
Dred Semodio, Tony Lenoir and Chris Allen Villanueva contributed to this article.
This article was published by S&P Global Market Intelligence and not by S&P Global Ratings, which is a separately managed division of S&P Global.