
Grid operators continue to grapple with overcrowded interconnection queues as the latest aggregation from S&P Global Commodity Insights puts combined capacity awaiting interconnection at more than 2,200 GW. Colocated configurations are increasingly popular, and hybrid projects lead all other stand-alone technologies in cumulative queue capacity at over 800 GW, with roughly 85% coming specifically from solar-plus-storage systems.

– Aggressive solar development across the western US and Texas is resulting in rising curtailment rates and reduced peak demand contributions for incoming projects. Developers have taken notice, as evidenced by interconnection queue additions. Across the West region, including California ISO, over 92% of proposed solar capacity — currently totaling 456 GW — is planned to be paired with energy storage.
– Hybrid systems are less popular across eastern regions, with interconnection queues for Midcontinent ISO, New York ISO, PJM Interconnection LLC, Southwest Power Pool and the non-ISO Southeast featuring less than 30% of solar capacity that is part of a hybrid system. Stand-alone storage, however, is increasingly popular, particularly in Electric Reliability Council of Texas Inc. (ERCOT), PJM and NYISO, where combined capacity exceeds 237 GW across the three queues.

Market saturation driving up curtailment
Utility-scale solar deployment continues at a blistering pace around the US, with installed capacity more than doubling since 2021. The geographic footprint of grid-scale solar is also expanding — in 49 of the 50 states — with 21 of them having at least 1 GW of operating photovoltaic capacity. That said, development remains concentrated in a handful of markets with the top three states in installed capacity — Texas, California and Florida — accounting for 49% of the US total.
Download the 2024 US interconnection queues analysis and its Excel companion.
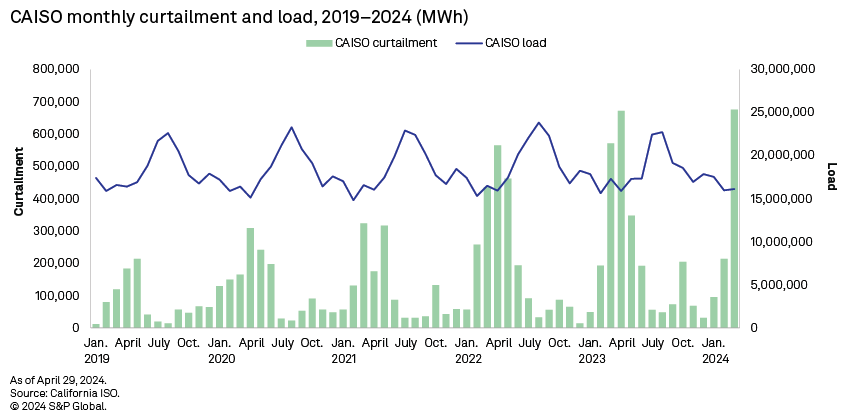
Due to this aggressive development, solar curtailment rates are rising in CAISO and ERCOT. In CAISO, annual curtailment has risen from 922 GWh in 2019 to 2,509 GWh in 2023. There are no signs of a slowdown either, as the monthly solar curtailment record in CAISO was broken again in March 2024, reaching 676 GWh.
In ERCOT, there was a ninefold jump in estimated solar curtailment, from 248 GWh in 2019 to 2,266 GWh in 2022. This resulted from operating solar in ERCOT growing from 2.7 GW to 12 GW over the same period. ERCOT set a record in 2023, adding 6.4 GW of solar to the grid; curtailment levels declined from 2022, however, down to 1,933 GWh. This is partially due to increasing load in Texas, with annual demand rising 14% from 2021 to 2023. CAISO energy demand, by comparison, remained flat during 2019–23.
 |
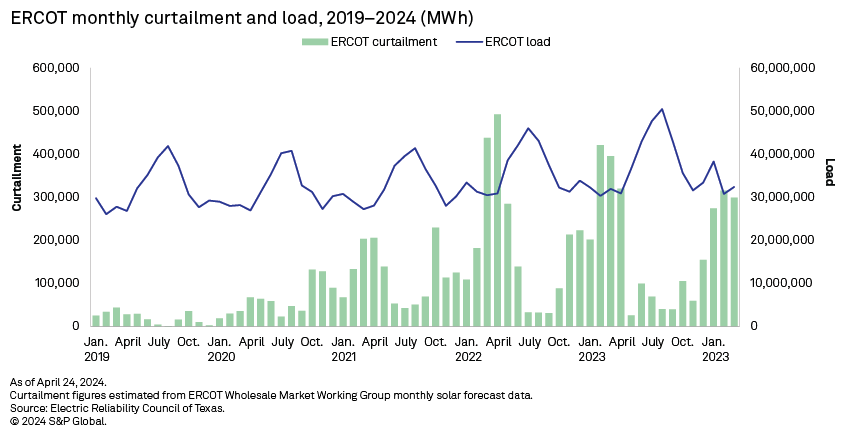 |
Additionally, nearly two-thirds of 2023 solar installations in ERCOT occurred in the fourth quarter, so the full impact of the record-setting growth is only now beginning to be realized. Curtailment levels from the first quarter of 2024 put Texas on pace to surpass the highs reached in 2022.
In addition to curtailment, high solar penetration undercuts the impact of new solar generation's ability to contribute during peak demand. In CAISO, this is quantified by a metric called Effective Load Carrying Capability (ELCC). New solar generation has an ELCC of roughly 5%, which is forecast to decline to nearly zero by the end of the decade. Comparable results are anticipated in Arizona, Nevada and Texas.
Slightly under 27% of installed solar capacity in ERCOT has colocated battery storage with it to help ease curtailment and maximize solar generation; this is up from just 13% in 2020. Similarly, operating solar capacity in CAISO and the non-ISO West is 25% and 24% paired with storage, respectively.
Hybrids increasing in interconnection queues
Developers are increasingly aware of this dynamic, as evidenced by capacity proportions in interconnection queues across the US. In CAISO especially, paired storage is essentially becoming a requirement as more than 98% of the 225 GW of proposed solar capacity in the cluster 14 and 15 queues is paired with energy storage.
Queues from utilities across the non-ISO West paint a similar picture, with 231 GW of solar capacity in aggregate proposed across the West outside California. Hybrid systems account for 87% of this capacity. Comparatively lower forecast energy demand in states such as Arizona and Nevada, combined with strong operating solar generation, has developers modeling future scenarios and seeing the need for colocated storage to maximize the production and revenue of their solar facilities.
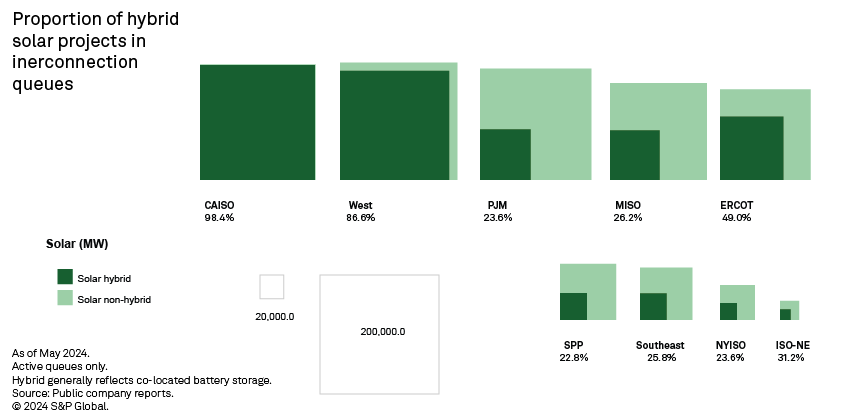
ERCOT does not tag hybrid systems currently in its interconnection queue, but connecting solar and storage projects with matching developers and grid interconnection points indicates just under half of the 138 GW of solar in interconnection queue is part of a hybrid system. Hybrid capacity of solar plus storage is now over 100 GW in ERCOT's queue. Another 94 GW of stand-alone storage awaits impact studies in ERCOT compared to 70 GW of stand-alone solar.
The remaining regions are well behind CAISO, the non-ISO West and ERCOT in terms of hybrid's share of planned solar capacity. PJM has over 200 GW of solar in its interconnection queue, but only 21% has colocated storage. Battery storage developers are hardly neglecting PJM, however. Over 105 GW of stand-alone storage is in the ISO's queue — second only to CAISO.
Similarly, shares of interconnection queue solar capacity that is part of a hybrid system hover in the low-to-mid 20% range for MISO, NYISO, SPP and the non-ISO Southeast. NYISO's queue currently favors wind, specifically offshore wind, over solar, but stand-alone storage is gaining steam with a proposed capacity of 38 GW — two and a half times higher than stand-alone solar. Likewise, stand-alone storage and offshore wind account for 85% of queue capacity in ISO New England.
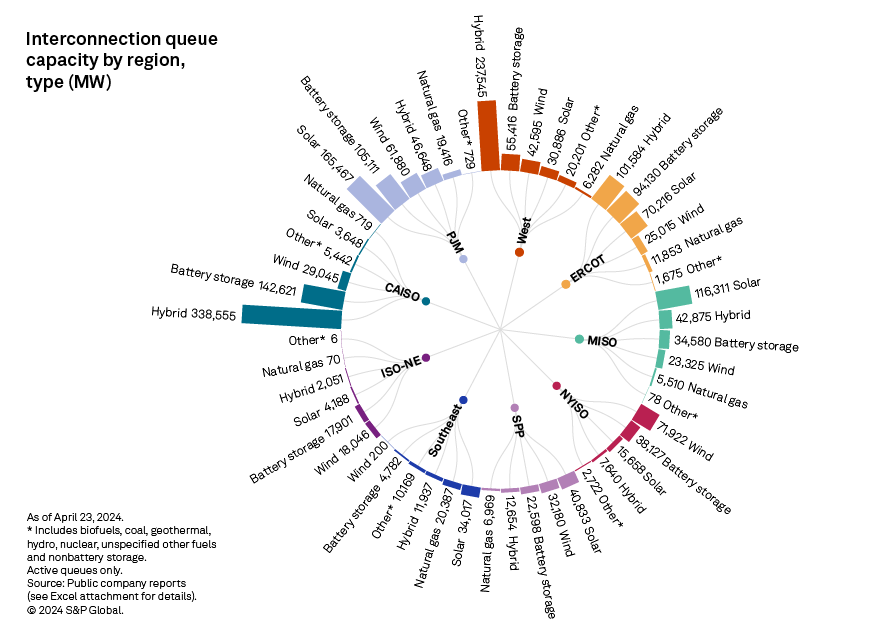
The non-ISO Southeast has historically lagged behind the rest of the country in clean energy deployment, and this seems to hold true for battery storage. Only 11.8 GW of hybrid solar capacity is in interconnection queues across the Southeast, ahead only of the smaller markets of NYISO and ISO-NE. The region also ranks last — by a wide margin — in stand-alone storage capacity, with less than 5 GW proposed, compared to 34 GW of stand-alone solar. This is on top of nearly 21 GW of operating solar generation, of which less than 5% is paired with storage.
Data visualizations by Chrisallen Villanueva.
For wholesale prices and supply and demand projections, see the S&P Global Market Intelligence Power Forecast.
Regulatory Research Associates is a group within S&P Global Commodity Insights.
S&P Global Commodity Insights produces content for distribution on S&P Capital IQ Pro.
This article was published by S&P Global Market Intelligence and not by S&P Global Ratings, which is a separately managed division of S&P Global.