The S&P Global Market Intelligence Pipeline Activity Index ticked marginally higher in May, increasing 3% to 83 from 81 in April. The base/other Pipeline Activity Index (PAI) improved markedly, increasing 24% in the month to 66 from 53, while the gold PAI retreated 9% to 104 from 115.
The metrics we used to calculate PAI were mostly positive for the month. Significant drill results, financings and positive milestones all increased, while the number of initial resources dropped significantly. As in April, most metals tracked in our Exploration Price Index (EPI) posted significant price increases in May. With higher metals prices, the market cap again pushed higher as mining equities continued marching higher.
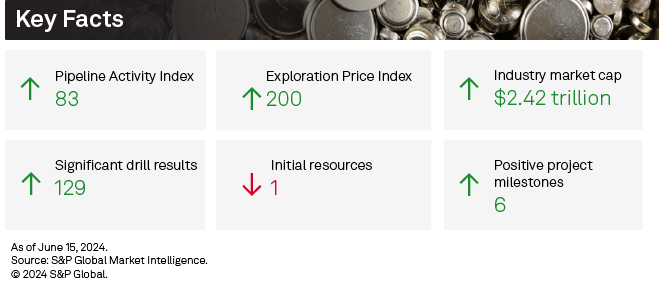
The PAI measures the level and direction of overall activity in the commodity supply pipeline by incorporating significant drill results, initial resource announcements, significant financings and positive project development milestones into a single comparable index.
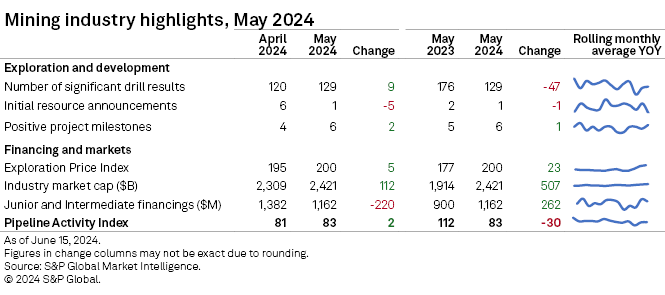
Detailed data on the PAI metrics is available in the accompanying Excel spreadsheet.
Fundraisings retreat, but gold doubles to 11-month high
After nearly tripling in April, funds raised by junior and intermediate mining companies fell 16% to $1.16 billion in May. The decline was fueled by lower copper and lithium financings and partially offset by an increase in gold financing, which rose for a fourth consecutive month. The number of transactions dipped slightly to 230, down from 237 in April. The number of significant financings climbed to 70, up from 54 in the previous month. Ten transactions were valued at over $30 million, compared with six in April.
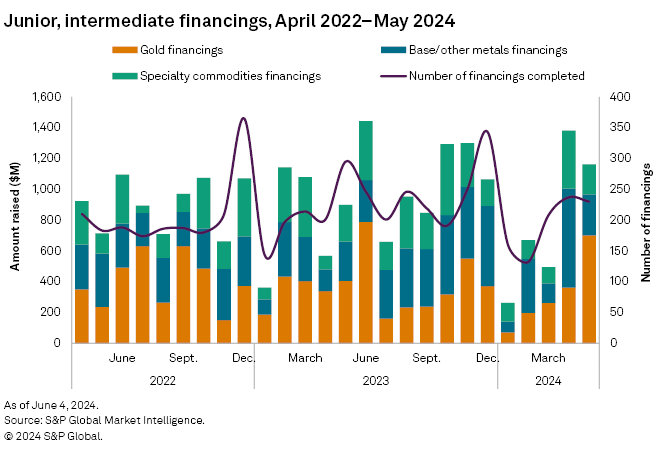
Gold financings jumped for the fourth consecutive month, up 93% to $701 million, fueled by high-value transactions. Four of the largest transactions in May were for gold companies and projects. The number of gold transactions was lower at 108, down from 125 in April. There were five transactions valued at over $30 million, up from three in April.
The base/other metals group fell 59% to $266 million in May after increasing fivefold in April. Lower funds raised for copper weighed down the group, offsetting an increase in silver financings. Despite lower funds raised, the number of transactions jumped to 72 from 65. Two transactions were valued at over $30 million in May, the same as in April.
Copper, silver keep number of projects drilling on upward trend
May marks the beginning of the busy exploration season for North America, and, true to form, both Canada and the US saw a boost in projects reporting drilling last month. Overall, projects drilled increased by 14 to 238, while the number of drillholes dropped by 318 to 3,316. Drilling increased at both late-stage and early-stage projects in May, up 25% and 5%, respectively, which aligns with the juniors in North America ramping up for the season, while minesite drilling decreased 18%.
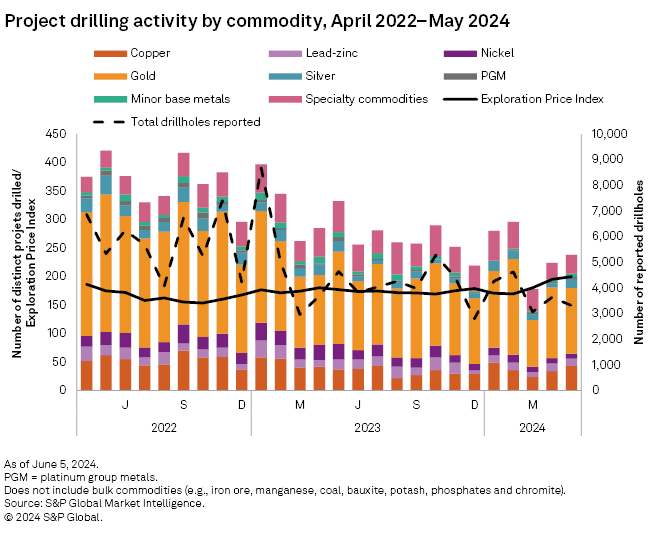
May's top result came from Australian Securities Exchange-listed Sunstone Metals Ltd.'s Bramaderos gold project in Ecuador. The project reported an intersect of 46.43 meters grading 23.00% molybdenum, 0.24 grams per metric ton (g/t) gold, 9.75 g/t silver and 0.06% copper. Sunstone expects to start a drilling project in June that will help define the mineralized system and prepare for a maiden resource announcement.
Initial resource announcements drop to just one
We identified only one initial resource announcement in May, the lowest number recorded in our dataset, which began in 2017.
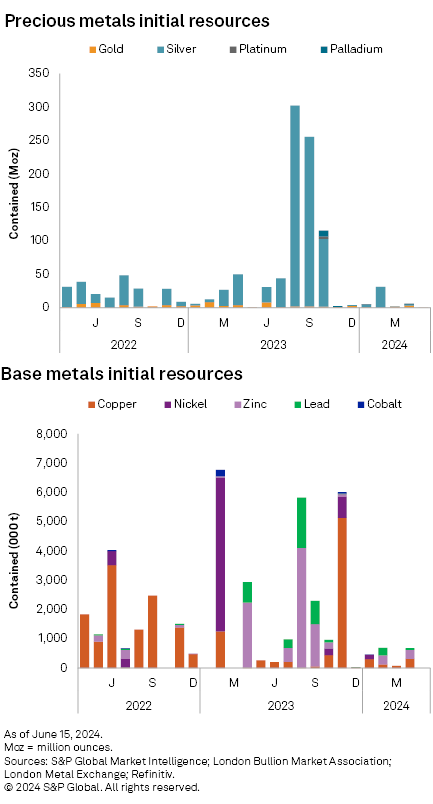
The sole announcement was also very small. It came from Nagambie Resources Ltd., which announced a maiden resource for its gold-antimony Nagambie mine in Australia. The company reports an indicated resource of 415,000 metric tons with 3.6 g/t Au and 4.3% antimony, containing 48,000 ounces gold and 17,800 metric tons Sb.
Positive milestones increase by two
May was a very strong month for milestones, with two more positive announcements than April. Four were for precious metal projects, and two were for projects focused on base metals. Four of the milestones were production-related, one was preproduction-related, and another announced the start of a feasibility study. Also, there were again no new negative announcements.
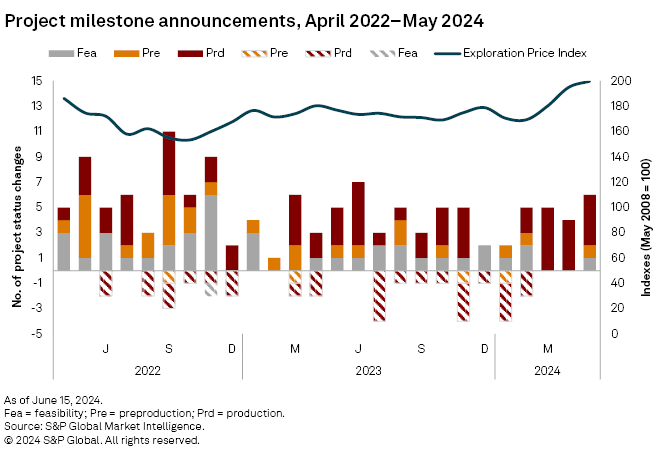
The production-related milestones came from Equinox Gold Corp., which announced first gold pour at its 100% owned Greenstone gold mine in Ontario; Golconda Gold Ltd. announced the commencement of mining at their South Africa Galaxy gold mine; Kuya Silver Corp. announced first production from their Bethania silver project in Peru; Battery Mineral Resources Corp. announced the resumption of copper concentrate production at Punitaqui in Chile; And finally, Bunker Hill Mining Corp. announced that they began constructing the processing plant foundation for the restart of the Bunker Hill mine.
On the feasibility side, Bluebird Merchant Ventures Ltd. announced that feasibility work has begun at the study at the Batangas gold project in the Philippines.
Exploration Price Index rises to record level
The Market Intelligence's EPI rose even higher in May, to 200 versus 195 in April. Like last month, nearly all metals in the index posted strong gains; the May index is a record high, beating the previous record from April. The gold price increase slowed in the month, gaining 0.7%, while silver and platinum posted strong increases, 6.9% and 7.9%, respectively. The base metals — copper, nickel, zinc and molybdenum — notched impressive sequential gains: 7.0%, 8.0%, 8.4% and 10.5%, respectively. Cobalt was again the only metal to decline month over month, slipping 1.4%.
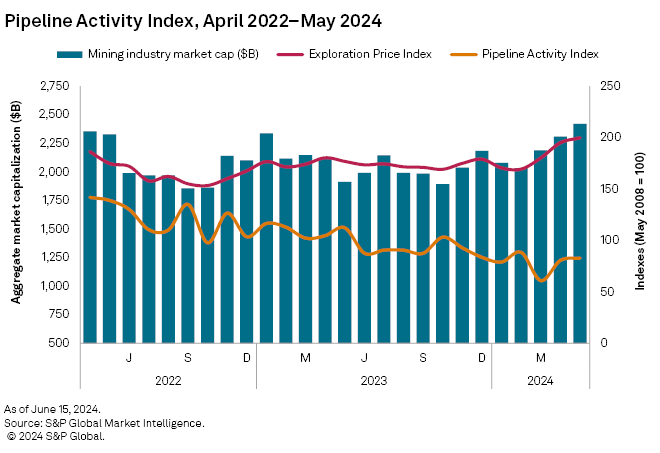
The EPI measures the relative change in precious and base metals prices, weighted by the overall exploration spending percentage for each metal as a proxy of its relative importance to the industry at a given time.
Strong metal prices continue to boost equities
The strength in commodity prices boosted mining equities even further in May. Market Intelligence's aggregate market capitalization of the 2,682 listed mining companies increased 4.8% to $2.42 trillion from $2.31 trillion in April. With May marking the third consecutive month of increases, the current market cap is the highest since March 2022.
S&P Global Commodity Insights produces content for distribution on S&P Capital IQ Pro.
This article was published by S&P Global Market Intelligence and not by S&P Global Ratings, which is a separately managed division of S&P Global.


