The S&P Global Market Intelligence Pipeline Activity Index fell steeply in August, decreasing 21% to just 61 from 78 in July. This is the lowest reading since March. The Pipeline Activity Index (PAI) is now nearing pre-COVID-19-era levels and is barely above the lows recorded during the height of pandemic lockdowns in 2020. The gold-specific PAI decreased 16% in the month to 86 from 103, and the base/other PAI declined 26% to just 41, compared to 56 in July.
The metrics used to calculate PAI were mostly negative in August. Significant drill results, positive milestones and initial resources decreased while only financings increased month over month. As in July, the gold price was strong enough to single-handedly support an increase in our Exploration Price Index (EPI). The August EPI hit a record high, breaking the previous high set in May 2024. Even with the record monthly gold price, weakness in base/other metal prices resulted in our mining equity aggregate industry market cap ending the month up only 0.04%, or essentially flat.
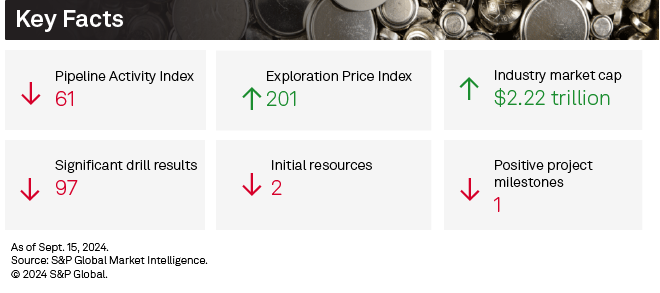
The PAI measures the level and direction of overall activity in the commodity supply pipeline by incorporating significant drill results, initial resource announcements, significant financings and positive project development milestones into a single comparable index.
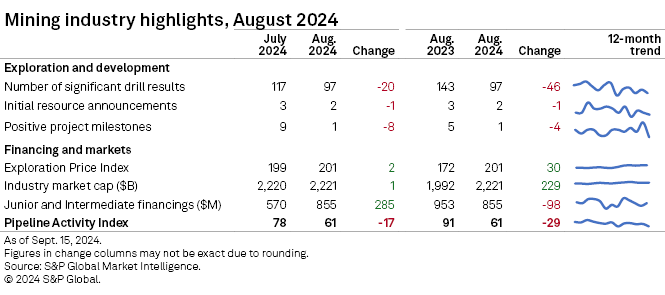
Detailed data on the PAI metrics is available in the accompanying Excel databook.
Funds raised rebounds to 3-month high
Following consecutive monthly decreases since April, funds raised by junior and intermediate companies jumped 50% month over month to $855 million — its highest since May. Funds raised in August were the third-highest monthly total in 2024, trailing the $1.38 billion in April and $1.16 billion in May. Both gold and the base/other group increased in August, but the specialty commodities group decreased for the second straight month.
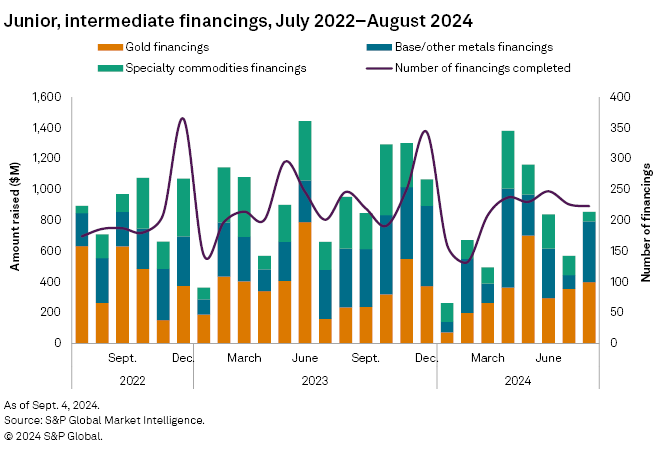
Gold financings increased for the second consecutive month, up 12% to $398 million in August. The number of gold transactions fell by two to 104 — the lowest in six months. Only one transaction was valued at more than $50 million, down from two in July.
The base/other metals group posted the largest increase amongst the three groups, up 344% to $396 million from $89 million. Higher funds raised, mainly from copper, buoyed the group, although nickel also contributed to the increase. The number of financings fell to 60 from 77, with three transactions valued at more than $50 million, up from none in July.
Drilling metrics all down
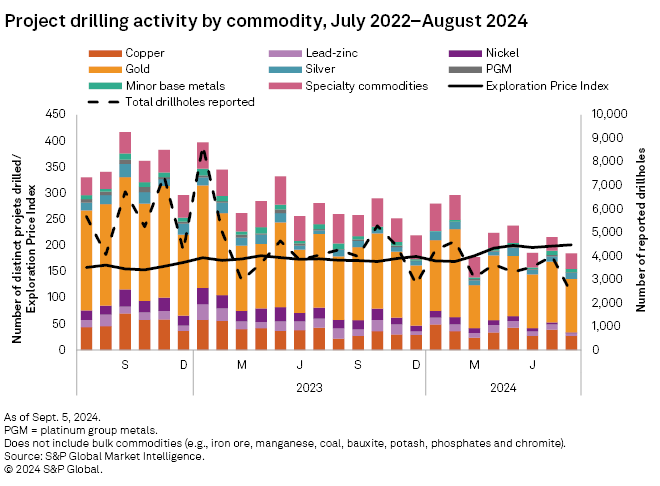
All drilling metrics declined month over month in August. Total drillholes fell to 2,410 — the lowest since March 2020 — with gold decreasing 39% and specialty metals decreasing 60%. Total drilled projects fell 14% to a five-month low of 185, while total companies reporting came in at 171, the lowest since June 2020. All drilling stages decreased month over month, with early-stage down 33%, late-stage down 3% and minesite down 14%.
August's top result came from NYSE American-listed Uranium Energy Corp.'s Roughrider project in Saskatchewan, with an intersect of 13.5 meters grading 6.96% uranium. The company completed an Ambient Noise Tomography survey program in August and plans a three-pronged approach to advance the Roughrider project.
Initial resource announcements drop by 1
Initial resource announcements dropped to two in August, one less than July. One announcement was for a gold-focused project, and one was for a silver-focused project.
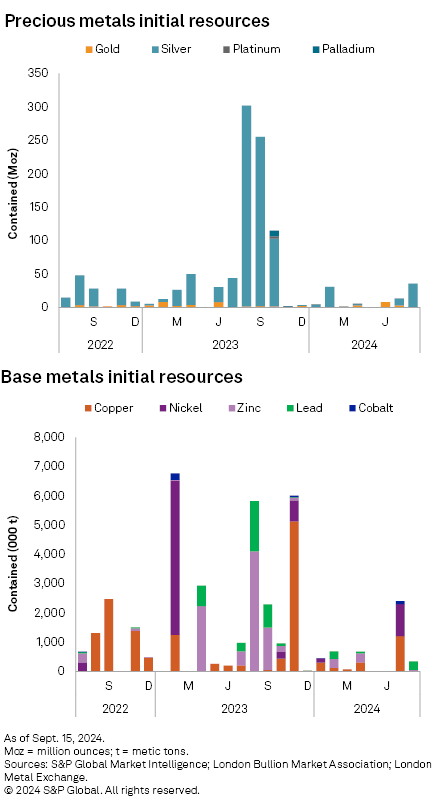
Turaco Gold Ltd. announced the maiden Mineral Resource Estimate at its 70%-owned Afema project in Côte d'Ivoire. The indicated and inferred resource estimate shows 64 million metric tons, grading on average 1.199 grams per metric ton, which brings total contained gold to 2.5 million ounces.
The other announcement came from Santacruz Silver Mining Ltd. While the company reported a Mineral Resources Estimate for three producing assets in Bolivia, there was an initial resource announcement for an adjacent deposit, Soracaya. The inferred resources are estimated at 4.1 MMt, grading 260 g/t silver, containing 34.55 Moz of silver
Positive milestones plummet
Only one positive milestone was registered in August, compared to nine in July. However, there was also a drop in negative milestones, with only one registered in August, compared to four in July.
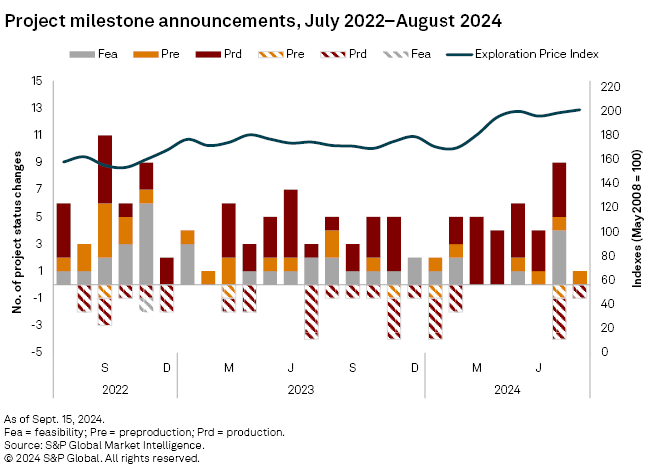
The one positive milestone came from Excelsior Mining Corp., which announced the mobilization of a crew to begin construction at Johnson Camp mine, a copper project in Arizona. The negative milestone came from IGO Ltd., which announced that Forrestania will enter into care and maintenance as the company looks to divest.
Exploration Price Index at record highs
Market Intelligence's EPI increased slightly in August, coming in at 201, breaking the record high of 200 registered in May. Given gold's overweight position in the EPI, the yellow metal's strong 3.1% month-over-month price gain was enough to push the entire index higher. Every other metal slipped month over month, most notably molybdenum (down 6.8%), copper (down 4.5%), silver (down 4%) and platinum (down 3.8%).
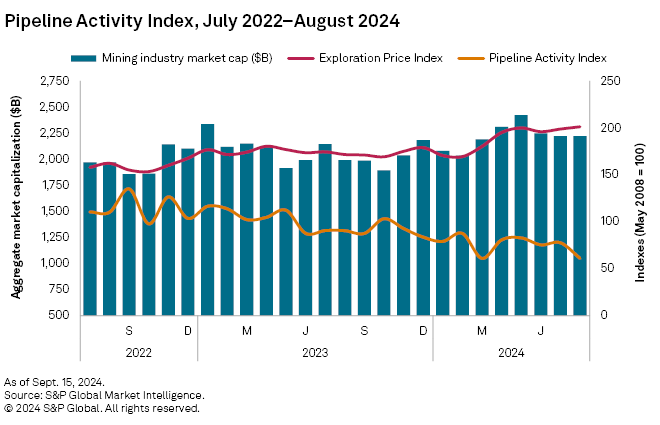
The EPI measures the relative change in precious and base metals prices, weighted by the overall exploration spending percentage for each metal as a proxy of its relative importance to the industry at a given time.
Gold price holds equity valuations firm
The strong gold price was enough to prevent mining equities from declining month over month. Market Intelligence's aggregate market capitalization of the 2,638 listed mining companies increased 0.04% to $2.221 trillion from $2.220 trillion in July.
S&P Global Commodity Insights produces content for distribution on S&P Capital IQ Pro.
This article was published by S&P Global Market Intelligence and not by S&P Global Ratings, which is a separately managed division of S&P Global.


