
US insurance companies continued to increase their investments in alternatives in 2022, according to S&P Global Market Intelligence's 2023 US Insurance Investments Market Report, even as the rising interest rate environment boosted the attractiveness of more traditional assets.
Other long-term assets reported on Schedule BA of insurers' annual statements include a range of alternative investments that include private equity and hedge fund interests, collateral loans, surplus notes and insurance company affiliates structured as limited partnerships (LPs) or limited liability companies (LLCs). With insurers having increasingly turned to alternatives for yield-enhancement purposes, certain aspects of Schedule BA investing have served as a focal point for several recent initiatives by the National Association of Insurance Commissioners (NAIC) to more accurately gauge potential risk.

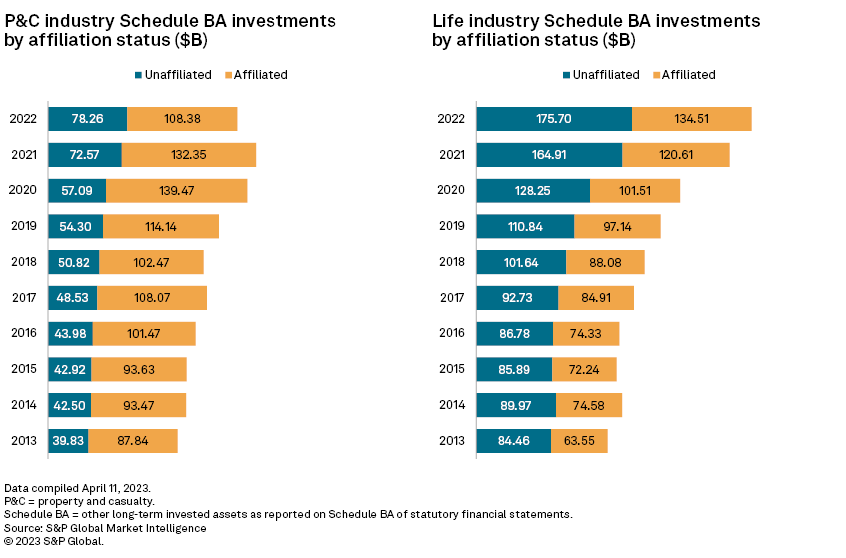
➤ The aggregate carrying value of the US life industry general account positions in other long-term invested, or Schedule BA, assets spiked by 72.3% during the five-year period ended in 2022, more than 3x faster than the overall pace of balance sheet expansion during that time. Schedule BA assets accounted for just over 7.0% of the industry's net admitted cash and invested assets as of Dec. 31, 2022, an increase of two full percentage points over a five-year span.
➤ The property and casualty industry's Schedule BA investments peaked from a relative standpoint in 2020 at 9.1% of net admitted cash and invested assets, but their subsequent decline to 8.4% in 2022 largely resulted from transactions involving subsidiaries of Berkshire Hathaway Inc. Excluding Berkshire, Schedule BA rose to a new high of 7.4% of the P&C sector's net admitted cash and invested assets in 2022.
➤ Gross yields on Schedule BA assets have typically run about 340 basis points above those for P&C and life general accounts portfolios, overall. Both sectors ran above those long-term averages in 2022 by varying extents, with the gross Schedule BA yield for life general accounts at 8.0%, or nearly 370 basis points above the overall portfolio. For the P&C sector, the yield of 12.6% was more than 910 basis points higher the overall yield on invested assets due to extraordinary transactions involving Berkshire's subsidiaries.

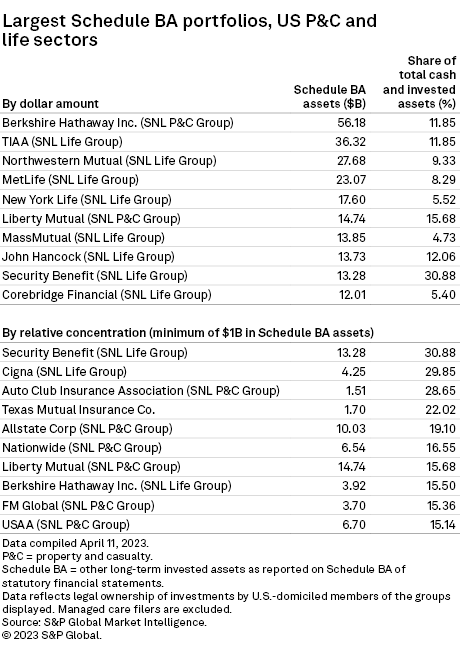
Berkshire is best known for its investments in publicly traded common equities through its insurance subsidiaries, but those companies also have material ownership stakes in non-insurance affiliates reported on Schedule BA. The 16.9% decline in the dollar value of Berkshire P&C group's Schedule BA investments in 2022 reflected a $10.5 billion distribution associated with Columbia Insurance Co.'s stake in BH Finance LLC and certain transfers and equity sales involving National Indemnity Co.'s affiliated Harney Investment Trust. The investment income associated with the Columbia distribution, alone, helped materially boost the P&C industry's overall yield on invested assets in 2022. National Indemnity's Schedule BA assets increased by $16.3 billion in the first quarter of 2023 in part due to a large additional investment in truck stop chain Pilot Travel Centers, reversing the company's full-year 2022 decline.
Other P&C groups, including Liberty Mutual Holding Co. Inc. and United Services Automobile Association, generated double-digit growth in their Schedule BA assets, leading to modest expansion in the P&C sector's overall holdings when excluding Berkshire.
Among life insurers, industry behemoths including TIAA, The Northwestern Mutual Life Insurance Co. and MetLife, Inc., maintain leading Schedule BA positions driven at least in part by investments in affiliated LLCs. The group led by Security Benefit Life Insurance Co., which ranked — relative to net admitted cash and invested assets — as the US life industry's largest Schedule BA investor with at least $1 billion in funds in that category, posted a year-over-year increase of 24.5%, due largely to its purchases of collateral loans.
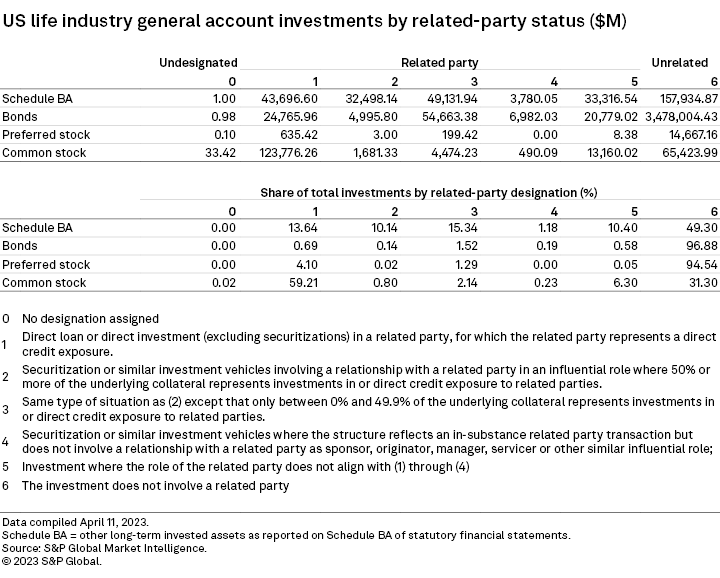
The S&P Global Market Intelligence analysis finds that 50.7% of the related-party investments within Schedule BA are comprised of positions in affiliated LLCs and LPs.
The NAIC implemented new reporting requirements for 2022 annual statements at the CUSIP level out of regulators' desire to obtain additional information on transactions involving related parties, regardless of whether the related party meets the formal definition of being affiliated. The NAIC expressed particular concern about the potential prevalence of relatedness in the context of structured securities, such as collateralized loan obligations, given the possibility for associated conflicts of interests and excessive fees in the portfolio.
Our analysis, which reflects a sum-of-the-parts compilation of various unadjusted annual statement codings within life insurer general accounts, finds that 13.5% of the aggregate carrying value of collateralized loan obligations had some degree of relatedness under the new disclosures. The prevalence of relatedness remained higher among Schedule BA assets when excluding affiliated investments at 16.1% of the associated aggregate carrying value, according to our analysis.
The availability of more attractive rates on high-quality, highly liquid fixed income instruments does not necessarily imply a slowdown in the expansion of Schedule BA assets. In addition to the sharp increase posted by National Indemnity in the first quarter and the presence of the large, permanent positions in affiliated LLCs and LPs, insurers have made material commitments for additional investments in private equity funds and certain other assets that constitute Schedule BA.
At year-end 2022, life insurers had made additional commitments for affiliated and unaffiliated Schedule BA investments of $16.64 billion and $63.85 billion, respectively. Both of those values are the highest on record on an absolute basis, though the implied relative increase in the aggregated carrying value of unaffiliated Schedule BA investments has pulled back from the levels seen from 2016 through 2020.
Methodology
The US Insurance Investments Market Report is based on data compiled April 11, 2023, and in some cases refreshed as of May 5. Statistics on allocations by asset class and yields reflect aggregations of P&C and life general accounts annual statement line items. The discussion of related-party investments is based on a bottoms-up analysis of as-reported data on individual investments and includes a limited amount of holdings by fraternal benefit societies.
Data is limited across sectors to US-domiciled insurers that file annual statements with the NAIC. Any references to investments by life insurers at the individual or US group levels reflect legal ownership and make no assumptions or representations regarding investments associated with coinsurance with funds withheld accounts where reinsurers bear the economic risk.
All data points in this article and the full report are subject to change based on any future restatements and the receipt of new information.
This article was published by S&P Global Market Intelligence and not by S&P Global Ratings, which is a separately managed division of S&P Global.