
Introduction
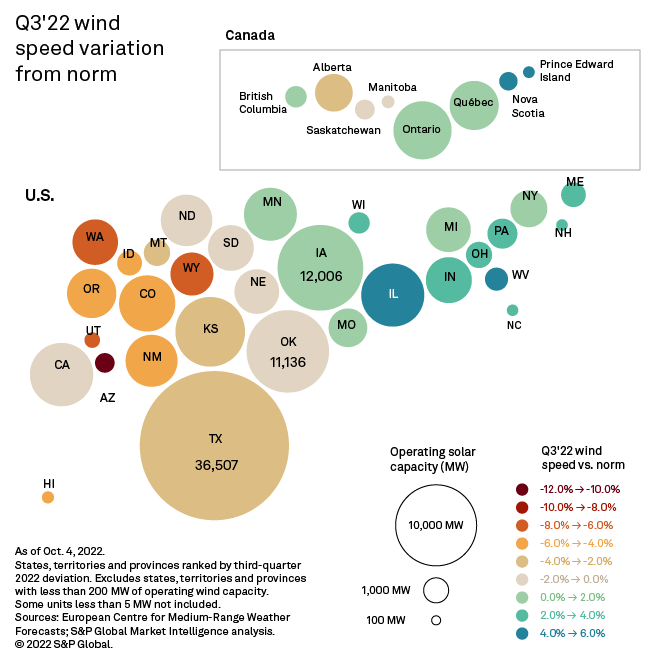
An analysis of 100-meter hourly wind speed data shows most Western U.S. states, the Texas Panhandle and western Oklahoma experienced below 20-year average speeds in the third quarter. U.S. wind energy capacity leader Texas recorded wind speeds 2.5% below the norm. In Iowa, where wind accounts for more than 50% of the state's generation fleet, wind speeds positively deviated 0.9% from the 20-year average. Storm Fiona contributed to sizable wind speed deviations in the Canadian Provinces of Nova Scotia and Prince Edward Island, up to 5.0% and 5.7%, respectively. Seventeen of the top 20 companies by wind capacity owned in North America logged negative deviations.

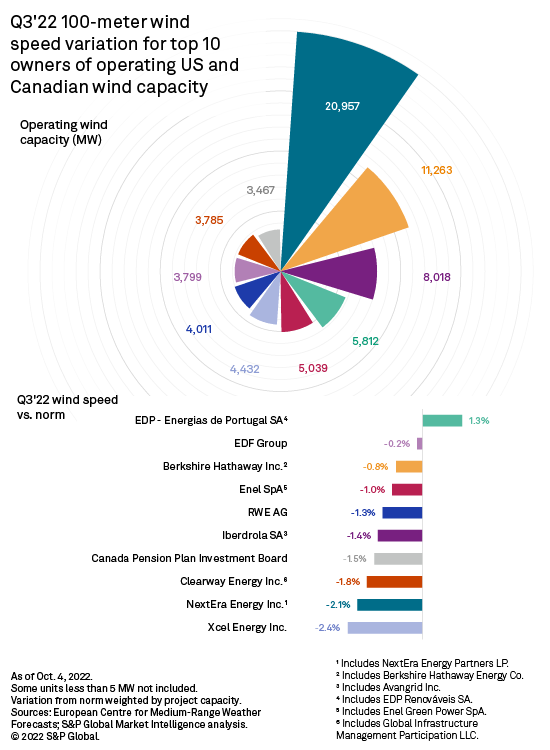
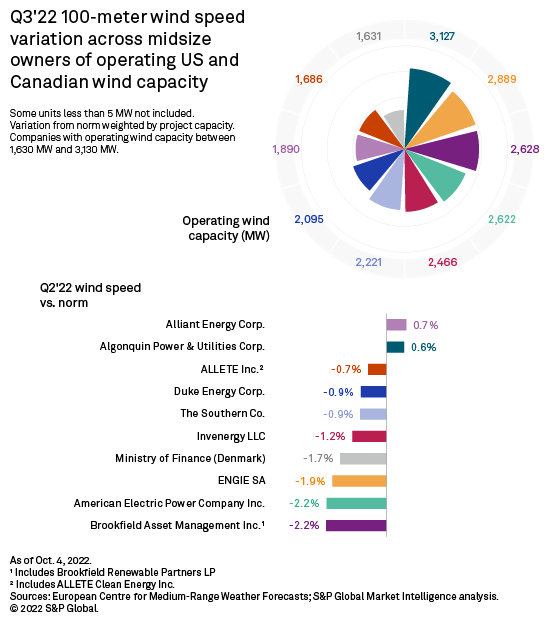
Only three of the top 20 companies by wind capacity owned in North America — Algonquin Power & Utilities Corp., Alliant Energy Corp. and EDP - Energias de Portugal SA, or EDP — experienced above-average wind speeds this quarter, with portfolio-weighted positive deviations ranging from 0.6% to 1.3%.
Wind speed potential deviations can impact company profits. NextEra Energy Inc., for example, reports that a 1% change in their wind production index causes a 1-cent change in their earnings per share.

EDP, the third quarter's top company in terms of wind speed deviation, had its wind projects strategically located to avoid this quarter's below-average wind speeds. A significant portion of its portfolio, totaling 3,929 MW, is in regions with above-average wind speeds, while some of its projects in states with below-average wind speeds managed to keep the company's project wind speeds above average or better than the average this quarter. Its top project by wind speed is at the Hog Creek Wind Farm (Hardin County North), with a 5.3% positive deviation from the 20-year average, a few percentage points higher than Ohio's state average for this quarter of 3.4% above its 20-year average.
Some EDP project wind speeds fared better than the state average, even in states with negative variation from their respective 20-year averages, notably in Kansas, Oklahoma and Texas. Wind speeds at EDP's Prairie Queen Wind Farm in Kansas are 2.8% higher than the 20-year average, but the state's third-quarter weighted average wind speeds are down 3.1% from the 20-year average. In Oklahoma, where the state's third-quarter weighted average wind speeds are down 1.4% from the 20-year average, EDP's 499-MW capacity in the state had wind speeds of between 1.9% and 3.6% above the 20-year average. Texas' third-quarter weighted average wind speeds are down 2.5% compared to the 20-year average, but EDP's Hidalgo & Starr Wind Farm (Los Mirasoles) and Hidalgo II Wind Farm's capacities totaling 300 MWs maintained a 0.7% positive variation, and the 180-MW Wildwind Project (Wildcat Creek) (ERAWIND) stands out at 3.5% above the 20-year average.
Alliant Energy, second to EDP in terms of deviation against the 20-year norm, happened to have its top wind speed projects located in Iowa, Minnesota and Wisconsin — states with better-than-average wind speeds this quarter. About 1,454 MW, or 77%, of its total capacity, is in Iowa. Alliant's 225-MW Great Western Wind Project in Oklahoma, co-owned with EDF Group, is the company's project with the lowest average wind speed —5.6% below the 20-year average.
Algonquin Power & Utilities, the only other top 20 company with an above-average wind portfolio, has 16 projects totaling 2,023 MW that vary positively from the norm. The company's Shady Oaks Wind in Illinois is its top wind speed project, with average wind speeds at 4.7% above the 20-year average. Only 1,103 MW of Algonquin projects vary negatively from the norm. The largest negative deviation is 5.2% below the 20-year average at the company's Texas-based 492-MW Maverick Creek Wind Project.
NextEra Energy continued to dominate the list of capacity ownership in the U.S. during the third quarter at 19,957 MW, followed by Berkshire Hathaway Inc., which owns 11,263 MW of wind capacity. Both saw a decline in their portfolio average wind speeds, with negative variations from the 20-year norm of 2.1% and 0.8%, respectively. NextEra generally reports that a one percent change in their wind production index causes a 1-cent change in their earnings per share.
Texas and Oklahoma have almost 8 GW of operating wind projects with a wind speed deviation at least 5% below average during the third quarter. The majority of projects with these wind speed deviations are in the Texas Panhandle and western Oklahoma. The region includes NextEra's Palo Duro Wind Energy Center, which has a power purchase agreement with Southwestern Public Service Co. for $22.6/MWh, and a negative 8.3% wind speed deviation that could cause a revenue decline for NextEra.
New Mexico is home to 4.4 GW of operating wind projects and had a third-quarter wind speed deviation 5.5% below the state's 20-year weighted average. The La Joya Wind Plant, owned by Iberdrola, has power purchase agreements with the Public Service Co. of New Mexico for $27.92/MWh and $17.48/MWh. Its negative 8.6% deviation this quarter could have monetary impacts on Iberdrola.
Some individual projects recorded large positive deviations during the quarter. Fire Island Wind Project in Alaska had a 13.9% positive deviation. Two wind projects in Puerto Rico, Planta Eólica Punta De Lima and Santa Isabel Pattern Wind Plant, had positive deviations of 11.0% and 8.5%, respectively. A 10.2% positive deviation was also found at Invenergy's Buffalo Mountain Energy Center in Tennessee.
California's state-wide average deviation is 0.1% below average, but some larger projects in California's bay-area show sizable positive wind speed deviations. Solano Wind has a positive deviation of 6.6%. Above-average wind speeds of 6% are found at Iberdrola SA's Shiloh I Wind Project and NextEra's High Winds Energy Center. Nearby Shiloh II Wind Project, with a 6.6% positive deviation, has a fixed, long-term average transaction rate of $86.9/MWh contracted to Pacific Gas and Electric Co. The positive deviation could incur a bonus for the owner, EDF Group.
Regulatory Research Associates is a group within S&P Global Commodity Insights.
Dred Semodio, Tony Lenoir and Chris Allen Villanueva contributed to this article.
This article was published by S&P Global Market Intelligence and not by S&P Global Ratings, which is a separately managed division of S&P Global.