Rate base and authorized return on equity are key financial metrics for utility companies and are closely watched by investors in the utility sector. Rate base growth is a key driver of earnings growth for a regulated utility and is frequently cited in company investor presentations and quarterly earnings calls, as well as reports from analysts that cover the utility sector.
The current return on equity (ROE) for a utility, whether authorized by a state public utility commission or the Federal Energy Regulatory Commission, is the return on the equity portion of the utility's rate base that the utility is allowed to collect in rates. A utility's authorized ROE is a matter of public record and is typically fixed for a period of time, in some cases for many years. On the other hand, the values of items included in a utility's rate base are constantly changing, and many of these items only appear in utility rate case filings and are not generally identified or disclosed in periodic publicly available regulatory or financial filings.
As an alternative to the traditional rate case filing, for many years, FERC has approved formula rate frameworks that allow electric utilities to automatically update their transmission rates annually, generally based on the utility's projected costs and revenues and subject to an annual true-up when actual data becomes available. These utilities also calculate their current transmission rate base, which is publicly reported in annual formula rate updates filed with the commission.
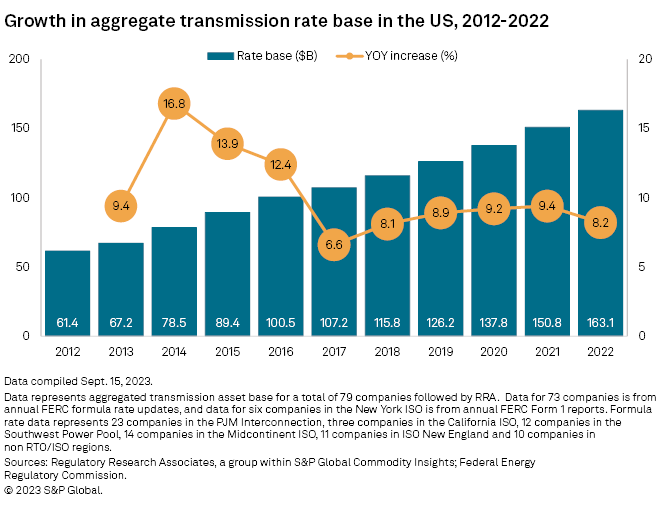
According to transmission formula rate data analyzed by Regulatory Research Associates, year-over-year growth of the aggregated transmission rate base of 79 utilities across all regions of the US rose to $163.1 billion in 2022 from $150.8 billion in 2021, or 8.2% — a decline from the 9.4% growth the prior year and reversing four consecutive years of accelerating growth for the same group of utilities.
The slowing year-over-year growth nationally was a reflection of lower growth from the prior year in five of seven regions in the US, including the PJM Interconnection LLC, where growth fell below 10% for the first time in five years.

➤ The slowing growth in transmission rate base nationwide observed in 2022 likely reflected lingering effects of the COVID-19 pandemic, including supply chain disruptions, declining demand, stock market volatility, tightening of the labor market and rising interest rates. Utility capital expenditures, a key driver of rate base growth, also slowed during this period. According to a recent report from the Edison Electric Institute, total capital expenditures by electric utilities in the US rose to $134.1 billion in 2021 from $132.7 in 2020, or slightly less than 1.1%. In October 2021 during the second wave of the pandemic, the institute projected total electric utility capital expenditures in 2022 of $139.3 billion, an increase of 3.9% from 2021.
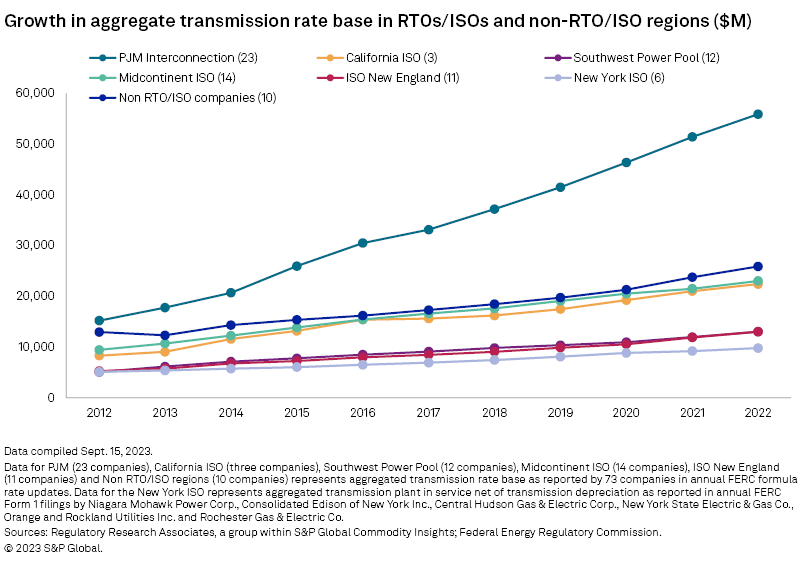
➤ Despite the lower growth in 2022, the 8.2% increase nearly equaled the average annual growth of 8.8% per year for the same group of companies over the five-year period from 2018 through 2022. The previous five-year period, from 2012 through 2017, witnessed volatility in the annual rate of growth but averaged a higher 11.8% per year. Over the full 11 years in this analysis, the rate base for the 79 companies increased by more than $100 billion, growing at a compound annual growth rate (CAGR) of 9.3%. Over the same time period, growth in the PJM Interconnection outpaced all other regions, as the region's rate base increased to $55.9 billion in 2022 from $15.2 billion in 2012 — a CAGR of 12.6%.
➤ Various analyses indicate transmission investment to facilitate the energy transition will continue to grow. The US Department of Energy released a draft needs study in March 2023, finding that transmission capacity may need to double by 2040, and researchers at Princeton University and the Massachusetts Institute of Technology have estimated that US transmission capacity may need to double or even triple by 2050. In April, RRA reported that capital spending on transmission for RRA-covered companies is forecast to be approximately $108 billion between 2023 and 2027.

Overview
In a recent Topical Special Report, "Rate base: It's more complicated than it sounds," RRA noted that "a utility's 'current' rate base is the value most recently adopted by [regulators], and efforts to estimate its value can be a perilous exercise." Utilities often suggest that rate base has been growing, or will grow prospectively, giving investors the impression that recent capital investments are reflected in rates. If the company has not had a rate case in several years and does not have a rate rider for new infrastructure investments, there has been no rate base growth per se, as rates do not yet reflect the incremental net investment.
RRA follows nearly 100 electric utilities with FERC-approved transmission formula rates and annually publishes a series of seven reports analyzing the utilities' most recently reported transmission rate base, annual revenue requirement and other ratemaking parameters. The reports analyze groups of utilities within six regions operated by regional transmission organizations or independent system operators (RTOs/ISOs), with the seventh report analyzing a group of utilities in non-RTO/ISO regions in the Southeast and Western US.
The RRA analyses include 11 years of data for each company from 2012 through 2022 where available, and also include the FERC-authorized base ROE for each of the companies at the time the most recent analyses in each region were published. In the most recent regional reports, authorized ROEs ranged from 9.72% for Xcel Energy Inc. subsidiary Public Service Co. of Colorado to 11.70% for FirstEnergy Corp.'s Trans-Allegheny Interstate Line Co., excluding any incentive ROE adders.
For comparison, a recent RRA report found that the average ROE authorized by state public utility commissions for electric utilities was 9.55% in rate cases decided in the first nine months of 2023, slightly above the 9.54% average for full year 2022: Energy authorized returns up modestly amid high-interest-rate environment.
A total of 79 companies in RRA's seven regional analyses that have a full 11 years of data available are included in this analysis of transmission rate base and rate base growth nationally, regionally and at the parent company and individual company levels.
Refer to the linked data tables for 2021–22 transmission asset base and authorized ROEs of utility operating companies by selected parent companies and an appendix containing 2012–22 transmission asset base data for 98 operating companies as available.
National growth
The 8.2% year-over-year growth for the 79-company group in 2022 was the slowest increase since the 8.1% growth recorded for the same group of companies in 2018. The annual growth rate increased each year since 2018 and reached 9.4% in 2021 before declining in 2022.

Looking back over the entire 11-year period in this analysis, the 79-company group reached a peak annual growth rate of 16.8% in 2014, reflecting an increase in total rate base to $78.5 billion from $67.2 billion in the prior year. The increase was driven, in part, by multiple transmission megaprojects with estimated costs of $1 billion or more.
Those megaprojects included the $1.2 billion 500-kV Susquehanna-Roseland Transmission line in New Jersey and Pennsylvania, which Public Service Enterprise Group Inc. (PSEG) subsidiary Public Service Electric and Gas Co. (PSE&G) and PPL Corp. subsidiary PPL Electric Utilities Corp. placed in service in early 2015 after three years of construction. The two companies also received FERC authorization to include 100% of construction work in progress in their respective rate bases during the project construction.
In California, Sempra subsidiary San Diego Gas & Electric Co.'s transmission rate base more than doubled from $1.22 billion to $2.82 billion from 2013 to 2014, largely due to the company's nearly $2 billion investment in the Sunrise Powerlink Transmission Project. Between 2012 and 2014, the transmission rate base for Edison International subsidiary Southern California Edison Co. rose to $4.68 billion from $3.26 billion, or 43.6%, reflecting in large part the company's investment in the Rancho Vista, Devers-Palo Verde II and Tehachapi transmission projects with an estimated total cost of approximately $2.5 billion. Southern California Edison also received FERC authorization to include 100% of construction work in progress in the company's rate base for the projects during construction.
Regional growth
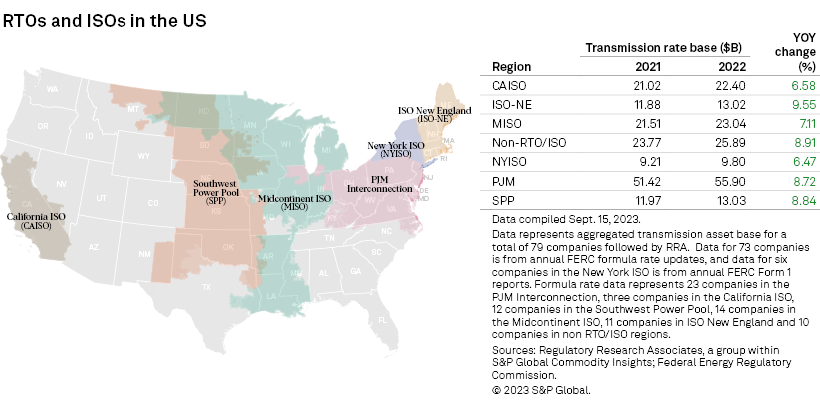
Transmission asset growth by region from 2021 to 2022 ranged from a low of 6.5% for the six companies in the New York Independent System Operator Inc. (NYISO) to a high of 9.5% for the 11 companies in ISO New England (ISO-NE). Year-over-year growth for the 23 companies in PJM, which represent just over one-third of the total transmission rate base of $163.1 billion in this analysis, fell to 8.7% in 2022 from 10.9% in 2021, the first time since 2017 and the only time in the years covered by this analysis, that annual growth in the region fell below 10%.

Growth in the NYISO rose modestly from the prior year, increasing to 7.2% in 2022 from 6.5% in 2021, while growth in the Midcontinent ISO (MISO) increased to 7.1% from 4.7%. In the other five regions, including PJM, annual growth slowed in 2022 from the rate of growth observed in 2021. For the companies in ISO-NE, growth slowed from 12.7% in 2021 to 9.5% in 2022, and in the Southwest Power Pool (SPP), growth slowed from 9.3% to 8.8%. Growth slowed from 9.2% to 6.6% in the California ISO (CAISO) and from 11.5% to 8.9% for a group of 10 companies that are located in non-RTO/ISO regions.

Looking at transmission rate base growth by region over the last five years, the group of companies in PJM averaged growth of 11.0% per year since 2018 despite the slower 8.7% growth in the region in 2022. The average growth per year since 2018 in all other regions was below 10%, with ISO-NE averaging 9.0%, MISO averaging 6.8%, SPP averaging 7.4%, NYISO averaging 7.2%, CAISO averaging 7.5% and the group of utilities in non-RTO/ISO regions averaging 8.4% per year.

Parent company growth
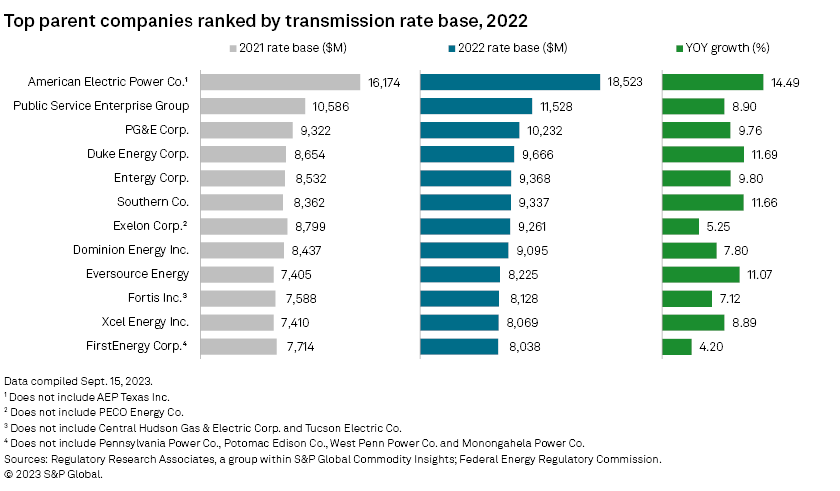
Aggregating available individual company data up to the parent company level, strong growth of 17.7% recorded by seven transmission-only (transco) subsidiaries of American Electric Power Co. Inc. (AEP) drove an increase in total rate base at the parent company to $18.52 billion in 2022 from $16.17 billion in 2021, or 14.5%.
The aggregate rate base for the seven AEP transcos rose to $9.92 billion in 2022 from $8.43 billion in 2021, making the total for the AEP transcos larger than all of the parent companies in this analysis except PSEG and PG&E Corp. The aggregate rate base for AEP's transcos surpassed the aggregate rate base for AEP's eight operating companies in 2020 and represented 53.6% of the parent company's total transmission rate base in 2022.
The total rate base for AEP's eight operating companies rose to $8.60 billion in 2022 from $7.74 billion in 2021, or 11.1%, led by 30.6% growth at Kentucky Power Co. and 12.4% growth at Indiana Michigan Power Co. AEP's six operating companies in PJM recorded much higher growth than AEP's two operating companies in SPP. The six PJM companies averaged 15.6% growth from 2021 to 2022, while AEP's two operating companies in SPP, Southwestern Electric Power Co. and Public Service Co. of Oklahoma, recorded year-over-year growth of 8.9% and 8.6%, respectively.
FERC authorized AEP's subsidiaries in PJM a 9.85% base ROE, while the company's two subsidiaries in SPP are authorized a 10.00% base ROE.

In addition to AEP's overall growth of 14.5%, three other parent companies in this analysis recorded double-digit rate base growth from 2021 to 2022. Duke Energy Corp.'s six operating companies reported a total transmission rate base of $9.67 billion in 2022, an increase of 11.7% over the companies' total rate base of $8.65 billion in 2021. The increase was driven largely by Duke Energy's largest operating company as measured by transmission rate base, Duke Energy Florida LLC, which reported a rate base of $3.00 billion in 2022, an increase from $2.55 billion in 2021, or 17.7%.
Duke Energy's subsidiaries operate in multiple regions. The company's two subsidiaries in PJM, Duke Energy Kentucky Inc. and Duke Energy Ohio Inc., are authorized a base ROE of 10.88%. Duke Energy Indiana LLC in MISO is authorized a 10.02% base ROE, while Duke Energy Florida, Duke Energy Progress LLC and Duke Energy Carolinas LLC are located in non-RTO/ISO regions and are each authorized a 10.00% base ROE.
The total rate base for Southern Co.'s three operating companies reached $9.34 billion in 2022, an increase from $8.36 billion in 2021, matching Duke Energy's growth of 11.7%. Southern Co.'s growth was driven by strong growth of 13.6% at Alabama Power Co. Southern Co.'s operating utilities are authorized a 10.6% base ROE.
Double-digit growth of 17.5% at NSTAR Electric Co. and 14.7% at Public Service Co. of New Hampshire drove an increase in Eversource Energy's total transmission rate base to $8.23 billion in 2022 from $7.41 billion, or 11.1%. The authorized base ROE for Eversource's four subsidiaries in ISO-NE is 10.57%.
Year-over-year growth for a fourth parent company, Entergy Corp., fell just below 10%. The five Entergy operating companies reported a total transmission rate base of $9.37 billion in 2022, an increase from $8.53 billion in 2021, or 9.8%. The parent company's growth was led by Entergy Louisiana LLC, the largest of Entergy's operating companies as measured by transmission rate base, which reported an increase in rate base to $4.40 billion from $3.86 billion, or 14.1%. Entergy's operating companies are all members of MISO and are authorized a 10.02% base ROE.
Individual company growth
Historical transmission rate base, revenue requirement, ROE and other ratemaking parameters for all of the individual companies followed by RRA are reported in the regional analyses published between Jan. 11, 2023, and May 11, 2023, for PJM, CAISO, MISO, SPP, ISO-NE, NYISO and the group of utilities in non-RTO/ISO regions.
Highlighting the largest individual companies nationally, six companies reported a transmission rate base of more than $5 billion in 2022. Three of those companies are located in PJM — Dominion Energy Inc. subsidiary Virginia Electric and Power Co. (VEPCO), PSE&G and PPL Electric Utilities.
The rate bases rose: for VEPCO, to $7.75 billion from $7.16 billion, or 8.3%; for PSE&G, to $11.53 billion from $10.59 billion, or 8.9%; and for PPL Electric Utilities, to $5.41 billion from $5.16 billion, or 4.8%.
The sixth company reporting a rate base of more than $5 billion, Southern Co. subsidiary Georgia Power Co., is located in a non-RTO/ISO region. Georgia Power was the only company of the six to record double-digit rate base growth year over year, as the company's rate base rose to $5.60 billion in 2022 from $5.02 billion in 2021, or 11.6%.
About this analysis
As noted above, adjustments were made to the groups of utilities in the seven regional reports in order to analyze data for 79 companies at the national level for the full 11 years from 2012 through 2022.
Of the nearly 100 companies with formula rates followed by RRA, only 73 have a full 11-year transmission rate base data available from annual formula rate updates filed with FERC, and those 73 companies are included in this analysis.
Of the six companies in the NYISO in this analysis, only National Grid USA subsidiary Niagara Mohawk Power Corp. uses formula rates for transmission and reports annual rate base data. In the absence of rate base data from formula rate updates for all of the NYISO companies, FERC Form 1 data was used to estimate the transmission rate base for the six utilities in New York.
The estimated transmission rate base was calculated as transmission plant-in-service net of transmission depreciation for each year. In addition, FERC Form 1 data for calendar year 2022 became available after the most recent regional NYISO report was published, and this analysis has incorporated the new Form 1 data for the six New York utilities.
The ROE data in this analysis is from the most recent RRA regional analyses and reflects the base ROE, any incentive ROE adders and the relevant rate years for each company at the time the analyses were published.
The rate base data in this analysis for non-NYISO companies is from each company's initial formula rate update each year and does not reflect any subsequent true-ups or corrections that may have been filed by any company.
Aggregated data for some parent companies in this analysis does not include data for certain of their subsidiary companies that do not use formula rates or are not included in RRA's regional reports, and these are noted where applicable.
Regulatory Research Associates is a group within S&P Global Commodity Insights.
S&P Global Commodity Insights produces content for distribution on S&P Capital IQ Pro.
For a complete, searchable listing of RRA's in-depth research and analysis, please go to the S&P Capital IQ Pro Energy Research Library.
This article was published by S&P Global Market Intelligence and not by S&P Global Ratings, which is a separately managed division of S&P Global.


