
Following a successful performance at the Jul. 21 elections, Prime Minister Shinzo Abe now has a remaining term until 2021 to ensure continued economic growth, the Wall Street Journal reports. That may prove to be a particular challenge in the export arena where Japan has seen a marked slowdown.
Panjiva analysis of official data shows that there was a 1.8% year over year contraction in exports in the 12 months to Jun. 30, which accelerated to 5.6% in 2Q. That followed three years of growth of just 2.5% annually through Dec. 31, 2018.
Following the signing of the Economic Partnership Agreement (EPA) trade deal with the European Union, Prime Minister Abe faces two major threats and two major opportunities to develop Japan’s trade relations further.
EXPORTS IN REVERSE SINCE MID-2018
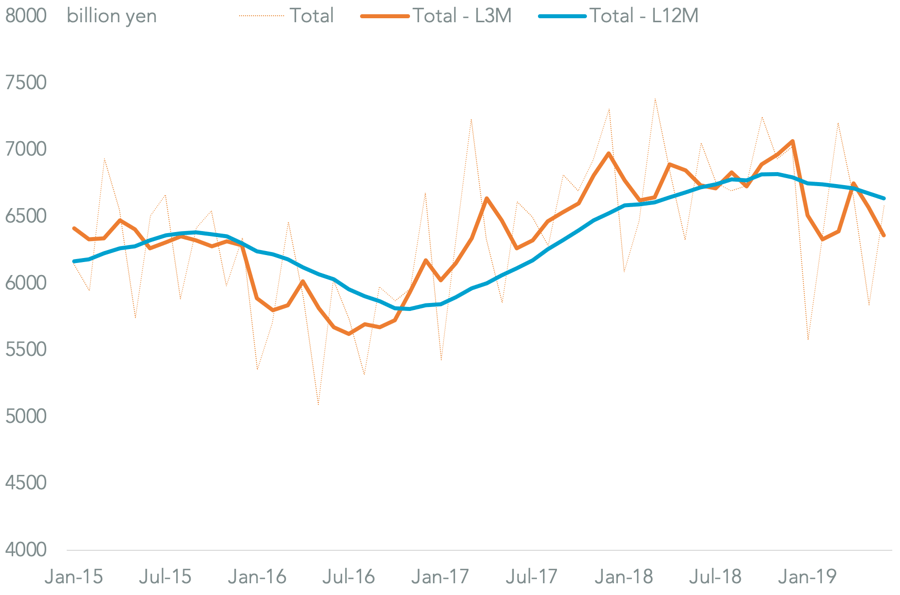
Chart shows Japan’s total exports on a monthly, three-month and 12-month average basis. Calculations based on Ministry of Finance data. Source: Panjiva
Trade negotiations with the U.S. have been ongoing through most of 2019 so far, but timing is becoming more pressing. Japan is the fourth largest contributor to the U.S. trade deficit with a $68.6 billion balance in the 12 months to May 31, Panjiva analysis of Census Bureau data shows. The other big three – China, the EU and Mexico – are either in negotiations or at loggerheads with the U.S.
The biggest issue between the two countries is the ongoing U.S. section 232 review of the automotive industry, which represented 36.2% of Japanese exports to the U.S. in 2018. A decision on that case, which may color wider trade negotiations between the U.S. and Japan, is due in November as outlined in Panjiva’s research of July 3.
Outside the automotive industry, the Japanese government will likely want to focus on the prospects for industrial materials and machinery sectors, though growth has already been significant recently.
Panjiva data shows the biggest four export lines to the U.S. have all seen double digit growth in the past 12 months including:
- construction and agricultural equipment from exporters including Komatsu, Kubota and Hitachi Construction worth $5.80 billion in the 12 months to May 31, with growth of 13.2%;
- pharmaceuticals worth $3.32 billion after a 33.9% including Hisamitsu Pharma and Lead Chemical;
- semiconductor manufacturing machinery worth $3.50 billion which grew 20.9%, led by Tokyo Electron and Hitachi High Tech; and
- chemicals worth $3.19 billion after a 28.1% expansion including shipments by Sumitomo Chemical and Mitsui Chemical.
RAPID GROWTH IN JAPANESE EXPORTS TO THE U.S. OUTSIDE OF AUTOS
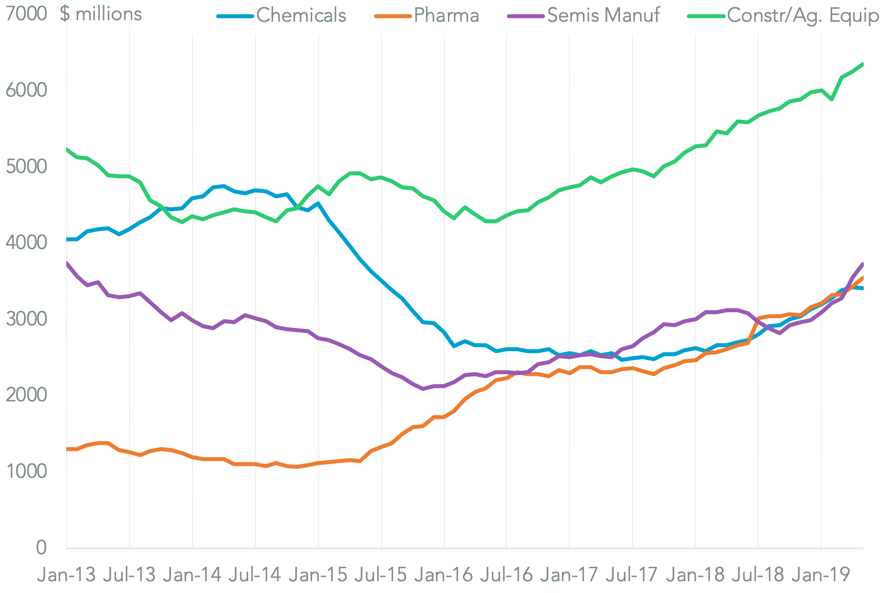
Chart shows U.S. imports from Japan on a rolling 12-month basis for chemicals, pharmaceuticals, semiconductor manufacturing equipment and construction / agricultural equipment. Source: Panjiva
While negotiations with the Trump administration will likely prove transactional, the relationship with South Korea is firmly geopolitical in nature. The worsening relations between the two countries regarding post-occupation reparations has already resulted in a South Korean court ruling against two Japanese firms regarding reparations, and Japan’s retaliation via limits on exports of semiconductor etching materials. Japan has also promised further measures, possibly including the removal of South Korea’s “trusted buyer” status Yonhap reports.
Trade between the two countries has already entered a significant downturn, with bilateral trade having fallen by 9.3% year over year in 2Q after a 10.5% slide in 1Q and growth of 2.5% in 2018. Japan’s imports from South Korea fell 6.9% in 2Q while its exports to South Korea slumped 10.8%.
JAPAN-KOREA TRADE ALREADY IN REVERSE EVEN BEFORE THE LATEST TROUBLES
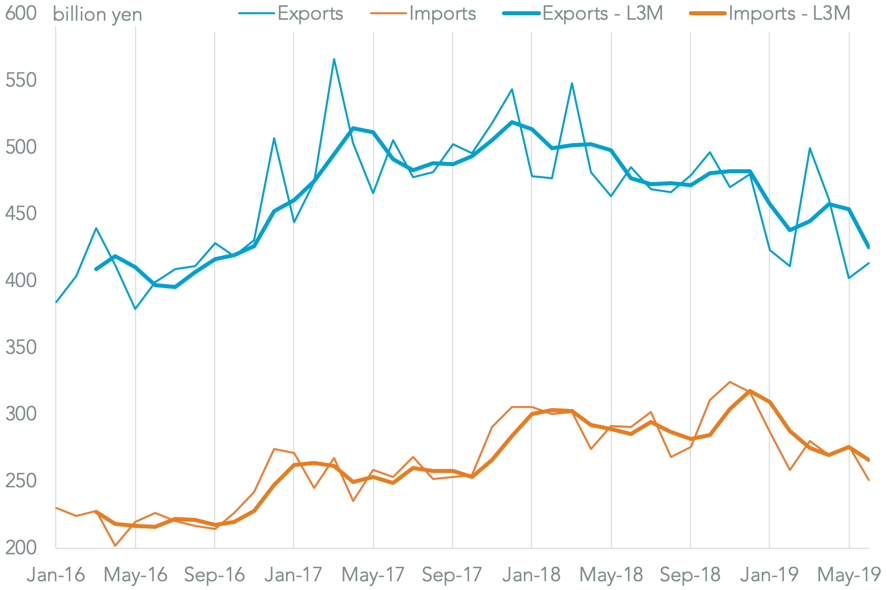
Chart segments Japanese trade with South Korea by direction on a monthly and three-month average basis. Calculations based on Ministry of Finance data. Source: Panjiva
The potential for disruption to their own and regional supply chains makes an all-out trade war unlikely, though disruptions to individual products – such as the semiconductor metals already discussed – may continue. As well as restricting exports the government may take a more aggressive stance on imports from South Korea.
In 2018 the leading import lines from South Korea included: refined oil products, equivalent to 544.0 billion yen, or 15.3% of all imports and where global alternatives are available; iron and steel equivalent to 9.5% of imports and where there’s been widening protectionism globally; and food which in broad terms was equivalent to 7.5% of the total.
JAPAN’S LEVERAGE LIES IN FUELS AND FOOD, KOREA’S IN MACHINES AND CHEMICALS
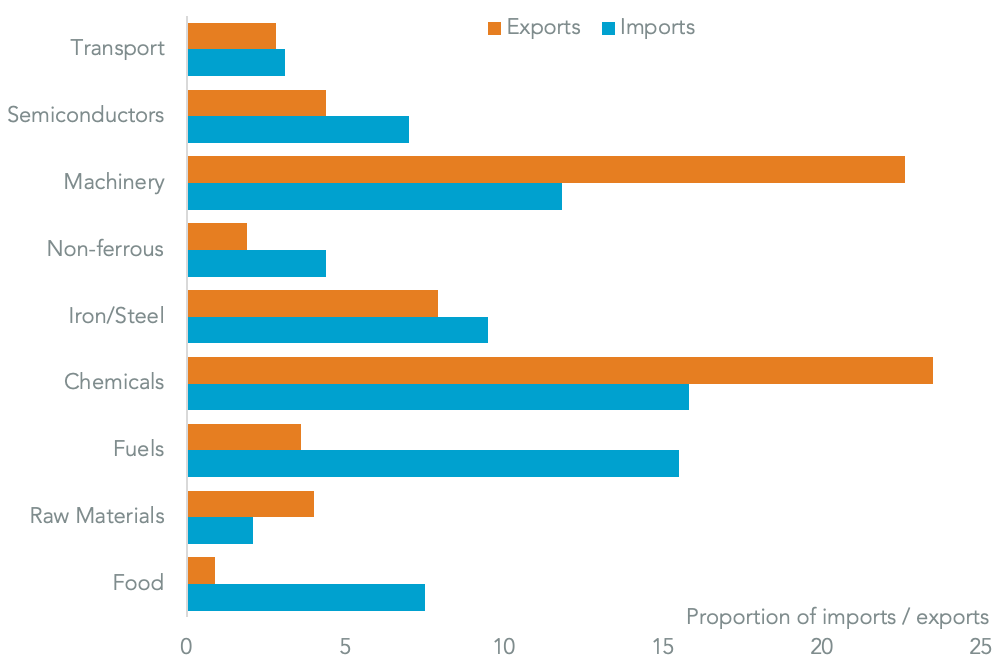
Chart segments Japanese trade with South Korea by product in 2018. Calculations based on Ministry of Finance data. Source: Panjiva
A trade dispute with South Korea makes the potential to pass the Regional Comprehensive Economic Partnership (RCEP) or extended CPTPP deals less likely. Losing out on RCEP in particular is a big deal – the countries included in the group accounted for 50.8% of Japan’s international trade in 2018 compared to 13.2% for the CPTPP group, 11.6% for the EU and 14.9% for the U.S.
RCEP, OR AT LEAST CHINA, IS THE BIG PRIZE FOR ABE’S DEALMAKING
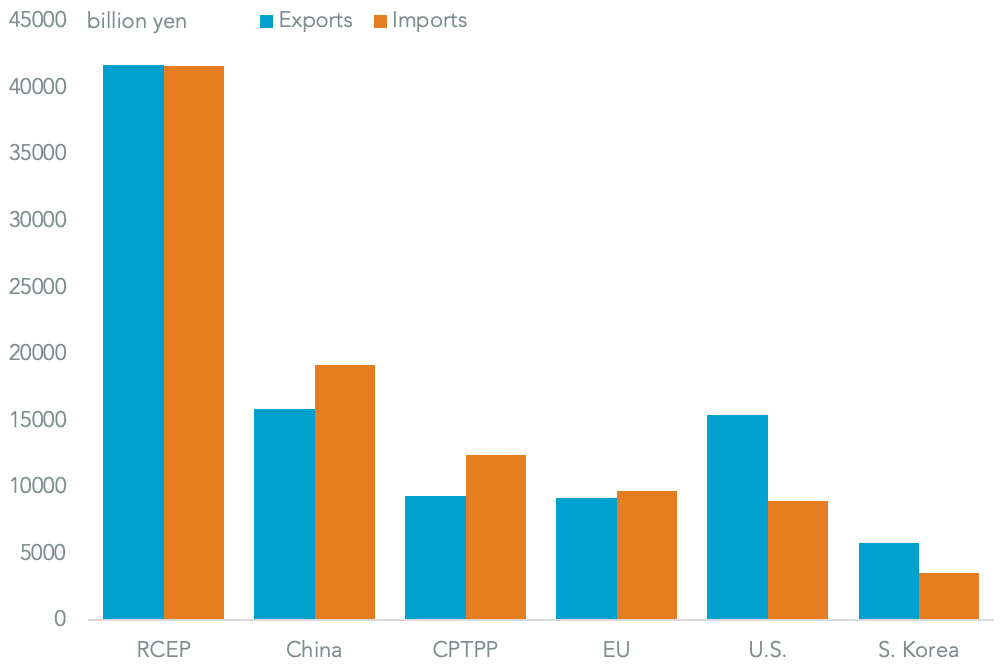
Chart segments Japanese trade by counterparty in 2018. Calculations based on Ministry of Finance data. Source: Panjiva