The liquidity crunch that emerged late in the first quarter will cause bank net interest margins to come under pressure and could lead to regulatory changes for regional banks, as well as an even greater focus on all banks' deposit composition and sources of liquidity, according to the 2023 US Bank Market Report.

Swift rate increases and a liquidity crisis at a handful of banks, including several major failures and shutdowns late in the first quarter, have placed a far greater premium on deposits at US banks. The search for deposits will cause already increasing deposit costs to accelerate at a quicker pace in the first half. Banks will also respond to the liquidity crunch by building reserves for loan losses, slowing loan growth and building cash on their balance sheets. Those actions, in conjunction with higher funding costs, will put pressure on margins and earnings.


Liquidity crunch put funding in focus
Significant increases in interest rates led to considerable margin expansion at US banks in 2022, as loan yields jumped while funding costs only rose modestly through the first nine months of the year. The environment began to change in the fourth quarter of 2022 when more customers moved their funds out of banks in search of higher rates in the Treasury and money markets. Those deposit outflows continued in the first quarter, leading to even greater liquidity pressures across the industry.
In late spring 2023, some institutions with exposure to the venture capital and technology space have seen their customers experience even higher cash burns, resulting in greater liquidity pressures. In the case of Silicon Valley Bank and Signature Bank, those pressures manifested in bank runs that culminated in those banks' failures in March.
The shifts in deposits will cause funding costs to rise significantly, particularly in the first half, as the fallout from the second- and third-largest bank failures in US history has sparked concerns over the entire banking industry's funding. The increased funding costs will serve as a headwind to banks' net interest margins.

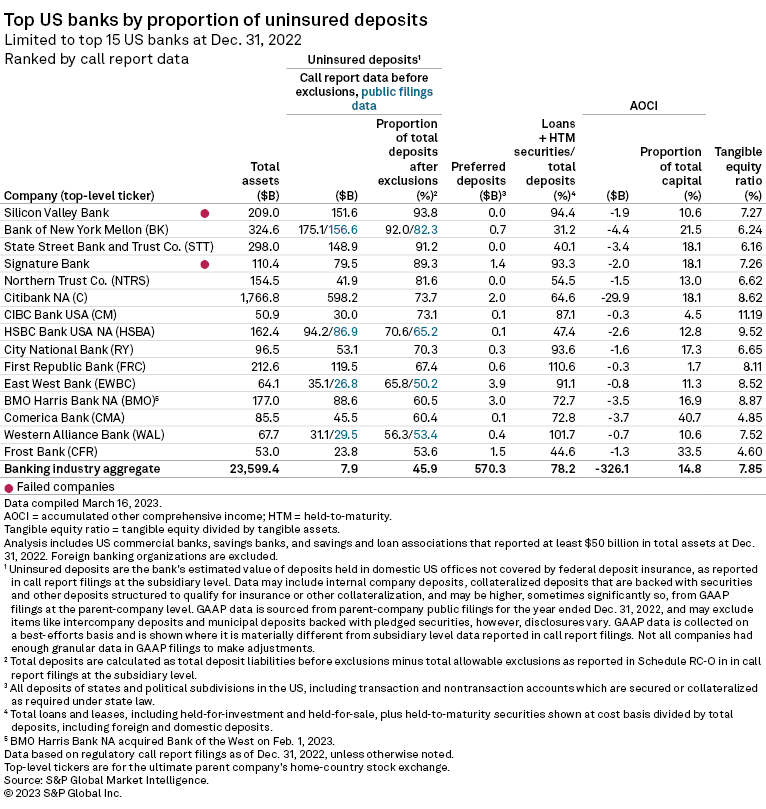
Silicon Valley and Signature had higher levels of uninsured deposits — meaning deposits greater than $250,000 and not covered by Federal Deposit Insurance Corp. deposit insurance — than other institutions, with those funds representing 93.8% and 89.3% of deposits, respectively, at year-end 2022. Uninsured deposits represented 45.9% of deposits for the banking industry aggregate. If an institution has a higher concentration of large deposits, it is arguably easier for cash to leave the bank quickly since fewer customers have to take action.
The investment community has also examined the ratio of loans plus held-to-maturity securities-to-deposits at a given bank to see how many deposits are tied up in less liquid assets. Silicon Valley's ratio of loans plus held-to-maturity (HTM) securities/total deposits was 94.4% at year-end 2022, while Signature's ratio stood at 93.3% compared to 78.2% for the banking industry in aggregate.
A few other institutions, such as First Republic Bank, that had an elevated level of uninsured deposits and a high loans plus HTM securities/deposit ratio reported notable outflows as well.
Most banks, though, say that their deposit balances have held fairly steady even in the face of liquidity fears that have emerged in the market. The Federal Reserve's H.8 data, which tracks commercial bank balances on a weekly basis, shows that deposits continued to decline in the first quarter, falling 2.8% through the week ended March 22. In the two weeks after Silicon Valley experienced a bank run, deposits at US commercial banks fell by $300.17 billion. Meanwhile, the Fed data shows considerable growth in time deposits across the industry.

Since a considerable portion of deposits are tied up in less liquid assets, including those that are deeply underwater, many banks' liquidity is stretched. That dynamic contributed to funding costs rising more notably in the fourth quarter of 2022.
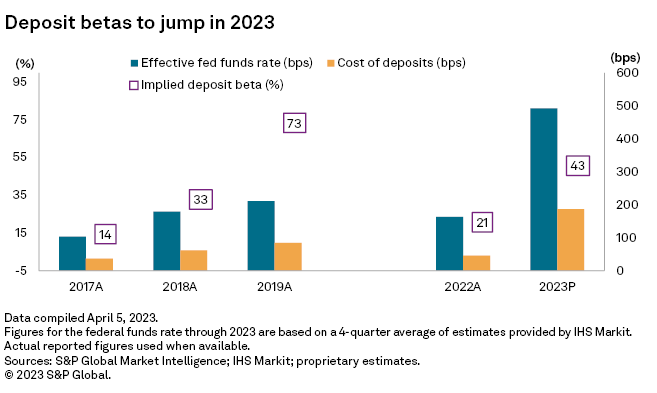
The banking industry recorded deposit beta on all deposits, including non-interest-bearing funds, of 20.7%, nearly in line with the 22% projected in our outlook in mid-December 2022.
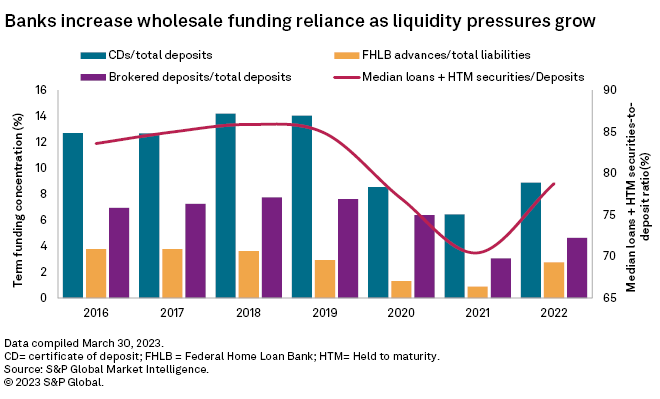
The pressure was even greater in the first quarter as deposit outflows accelerated due to the liquidity crunch at a few institutions. As institutions come closer to their own internal ceilings for their loan-to-deposit ratios, they will become increasingly hungry for new funding, and many will turn to CDs, borrowings and brokered deposits to satisfy their appetite, leading to higher deposit betas.
For full year 2023, we project betas to reach 43%, up significantly from our mid-December 2022 projection of 32% due to liquidity pressures in the market.
The higher deposit beta will put pressure on bank margins even as earning-asset yields continue to rise. We project net interest margins to contract 10 basis points in 2023 and then fall another 7 basis points in 2024. Economists expect modest declines in interest rates in 2024, which will pressure earning-asset yields, but funding costs should continue to grind higher as depositors continue to move funds out of non-interest-bearing deposits and into higher-cost offerings like CDs.

Looking ahead
Significantly higher interest rates and a crisis of confidence at a handful of institutions have put US banks' liquidity in the crosshairs and will lead to pressure on net interest margins. At the same time, economic uncertainty due to persistently high inflation, notable increases in rates and recent turmoil in the markets should cause banks to build reserves for loan losses in 2023. Taken together, margin compression and increased credit costs will take a bite out of bank earnings in 2023.
The headwinds to earnings could prompt some banks that had previously contemplated selling to take the plunge and partner with other institutions. Bank M&A activity through the first three months of 2023 stood at one of the weakest levels in history as institutions grappled with the fast-changing operating environment. However, the cost savings associated with deals will eventually make M&A an attractive way to mitigate earnings pressure.
Potential regulatory changes stemming from the liquidity crisis in March could also encourage future deal activity. Regulators have already suggested instituting greater regulation for institutions with more than $100 billion in assets. Silicon Valley and Signature both grew above that threshold after a 2018 policy change provided an off-ramp exempting banks with between $50 billion and $250 billion in assets from provisions like macroprudential regulation and the liquidity coverage ratio, both of which were designed to enhance the safety and soundness of institutions in the aftermath of the financial crisis.
While any new rules likely would take a while to be adopted, many banks, including those with below $50 billion in assets, could see new regulatory focus on their liquidity sources and deposit makeup. Regulators and bankers could view investments in their bond portfolio differently after the shakeout that occurred in early spring 2023 and might place greater importance on shorter-term, liquid investments. In the wake of the Silicon Valley Bank and Signature Bank failure, both regulators and bankers will also seek to limit uninsured deposit concentration and outsized exposure to single industries.
Scope and methodology
The outlook discussed in this article is based on a proprietary Market Intelligence model that utilizes the actual results of nearly 10,000 active and historical commercial and savings banks and savings and loan associations. The outlook is based on management commentary, discussions with industry sources, regression analysis, and asset and liability repricing data disclosed in banks' quarterly call reports. While taking into consideration historical growth rates, the analysis often excludes the significant volatility experienced in the years around the credit crisis.
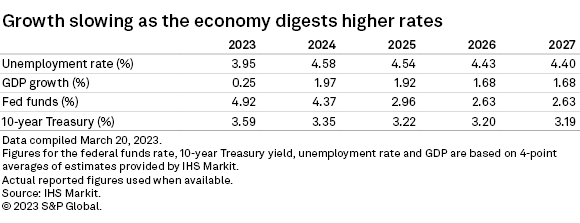
The outlook is subject to change, perhaps materially, based on adjustments to the consensus expectations for interest rates, unemployment and economic growth. The projections can be updated or revised at any time as developments warrant, particularly when material changes occur.

This article was published by S&P Global Market Intelligence and not by S&P Global Ratings, which is a separately managed division of S&P Global.


