
Introduction
Mapping out energy communities based on criteria specified in the Inflation Reduction Act of 2022 revealed that large swaths of the U.S. may currently qualify for 10% tax credit adders on new energy infrastructure. Further coal power plant retirements and coal mine closures could also contribute to expanding the pool of qualifying geographies, as might changes in the local unemployment rate, while the U.S. Federal Reserve further tightens monetary policy to bring down inflation.

With its "energy community" special rule, the Inflation Reduction Act incentivizes clean energy development in communities historically reliant on environmentally damaging fossil fuel industries, overlaying an economic revitalization strategy on top of energy transition objectives.
The law's energy community-qualifying employment criteria suggest that over 100 metropolitan and nonmetropolitan statistical areas, or MSAs and non-MSAs, will be eligible for the 10% tax credit step-up. Criteria on closed and retired coal assets, meanwhile, point to more than 2,800 identified U.S. census tracts across 42 states.
Further coal mine closures and coal power plant retirements will likely expand the qualifying census tract footprint, while an economic recession could lead to more eligible MSAs and non-MSAs.

Qualifying energy communities
As per the act, the qualifying energy communities include the following:
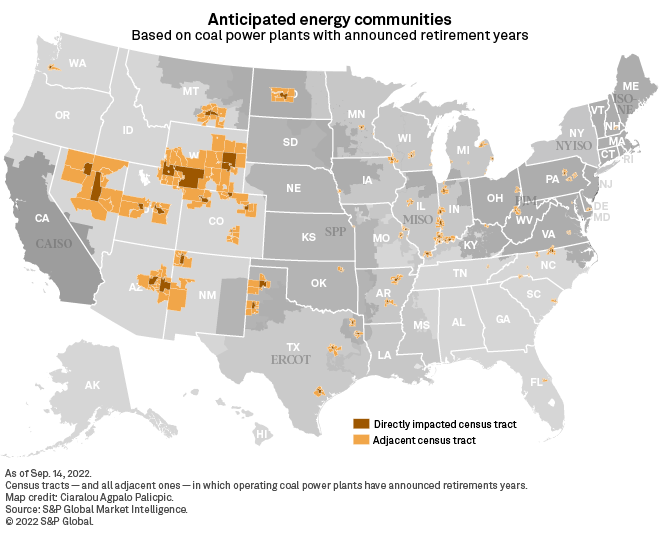
* Census tracts — and all adjacent ones — in which any coal mine has closed after Dec. 31, 1999, or in which any coal power plant has been retired after Dec. 31, 2009.
* MSAs and non-MSAs where, after Dec. 31, 2009, industries tied to fossil fuels have accounted for at least 0.17% of direct employment or 25% of local tax revenues, and where the unemployment rate is above the national average for the previous year.
* Brownfield sites — broadly land where the presence or potential presence of pollutants, contaminants or hazardous substances impedes development. The U.S. Environmental Protection Agency estimates there to be more than 450,000 — and possibly as high as a million — brownfield sites in the country.
S&P Global Market Intelligence data shows 142 coal mines have closed in the U.S. since 2000. States across or bordering the Appalachian mountains were particularly impacted, with Alabama, Kentucky, Maryland, Ohio, Pennsylvania, Virginia and West Virginia accounting for nearly 79% of all U.S. coal mine closures in the last 22 years.
Plotting U.S. coal power plants retired since 2010 paints an economically and socially similar but geographically contrasting picture. The phasing out of fossil fuels as a major source of power generation in the U.S. has led, among other things, to the closing of 339 coal power plants from 2010 through 2022 year-to-date as of Sept. 14, according to S&P Global Market Intelligence data. Inventoried coal power plant retirements were more geographically diverse than identified coal mine closures, affecting not only coal-rich Appalachia but stretching all the way to the West Coast, particularly affecting the Rockies.
Overall, S&P Global Commodity Insights identified over 2,800 census tracts qualifying for the eligible 10% increase to the act's baseline production and investment tax credits based on the law's closed mine and retired coal power plant criteria. Numbering nearly 4.7 million households, these census tracts are scattered across 42 states. Rust Belt states of Pennsylvania, Illinois and Ohio, with their historical trends of industrial decline over the past half-century, top the energy community charts based on the act's closed or retired coal asset criteria, displaying the largest amount of qualifying census tracts, as well as the largest pool of impacted households. That said, our map of the identified areas displays larger census tracts west of the Mississippi — a feature giving developers more geographical options, particularly when pursuing outsized solar and wind projects.
An additional 77 U.S. coal power plants, including 21 in Rust Belt states, have announced plans to retire in future years. An incremental 309 census tracts across 27 states could become eligible for the 10% increase in the act's tax credits based on these announcements alone, with Texas ranking first in impacted census tracts and households. Colorado and Missouri are neck and neck for the number two spot. Michigan rounds out the top four. Ultimately, all U.S. coal power plants may face a retirement decision if the U.S stays the course on its clean energy goals and commitments. The U.S. currently operates 261 coal power plants, with an aggregate operating capacity of 200 GW, according to Market Intelligence data.
Zooming in on the employment criteria for the act's energy community eligibility indicates at least 114 MSAs and non-MSAs qualifying, based on local and national unemployment rates from June 2021 to June 2022. It is important to note that the language used in the act suggests annual unemployment rates through regular calendar years as the benchmark for eligibility. However, this and other provisions of the law will likely need clarification from the U.S. Energy Department.
With employment and unemployment levels in constant flux, the act's employment criteria for extra energy community tax credits embody the proverbial "moving target." A potentially deteriorating employment environment on monetary tightening by the Fed, for example, could lead to an expansion of the pool of eligible MSAs and non-MSAs.
Commodity Insights identified an additional 120 MSAs and non-MSAs likely meeting the fossil fuel employment criteria — areas that would qualify for the act's 10% tax credit step-up if the local unemployment rate were to rise above the national average. Given the trend away from fossil fuels, our analysis assumes few changes to the identified fossil fuel employment footprint throughout the act's life.
While the act's clean energy production and investment tax credits have been making headlines, economic revitalization objectives underlie the law — hence its domestic manufacturing and sourcing quotas. By incentivizing developers and investors to focus on energy communities to build solar, wind and battery projects and clean-energy manufacturing facilities, the law seeks to accelerate the U.S. transition to clean energy while revitalizing communities historically reliant on fossil fuel industries.
Regulatory Research Associates is a group within S&P Global Commodity Insights.
Tanya Peevey and Ciaralou Palicpic contributed to this article.
This article was published by S&P Global Market Intelligence and not by S&P Global Ratings, which is a separately managed division of S&P Global.