
Movement toward a national clean energy policy is steadily gaining momentum. Enacting legislation to tackle climate change by reducing greenhouse gas emissions remains a cornerstone of the Biden administration's policy, and the proposed 80% clean energy by 2030 target, which increases to 100% by 2035, represents a significant first step. While this aggressive national policy would put billions of dollars of coal and natural gas generation investment at risk, it could spur upward of $94 billion annually in clean energy investment to build the 630 GW of wind and 450 GW of solar needed by 2035 to meet this requirement, according to an S&P Global Market Intelligence analysis.
The Take
- The current proposed Clean Electricity Performance Program, or CEPP, legislation aims for 80% reduction in carbon emissions in the energy sector by 2030 and going to 100% decarbonization by 2035.
- State renewable mandates, strong corporate interest, continued federal tax credits and declining costs are driving strong growth with over 60 GW in planning expected to come online in both 2022 and 2023.
- Despite strong market growth, the current trajectory in the U.S. falls well short of the goals proposed in the CEPP.
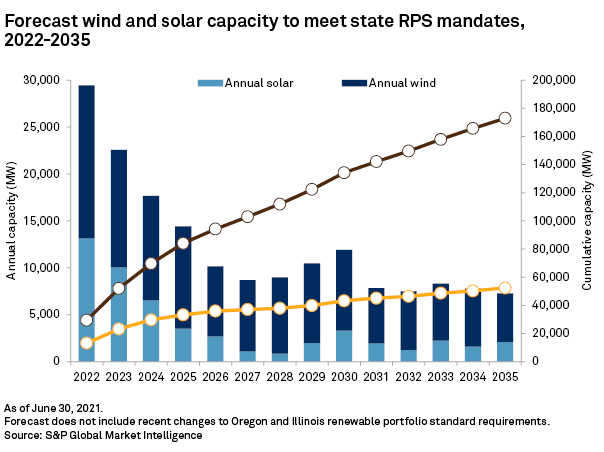
- Implementing these goals into the power forecast, Market Intelligence projects 85 GW per year of wind and solar to be built annually through 2035 and a cumulative total of 630 GW of wind and 450 GW of solar needed by 2035. This translates to a total investment of $1.2 trillion or about $94 billion annually.
- Even with this aggressive renewable build-out, increasing forecast curtailment could prevent the sector from achieving decarbonization, with over 480 GW of fossil fuel generation still expected to be in operation in 2035.
The House Energy and Commerce Committee is currently considering the CEPP, a bill that is part of a larger reconciliation package yet to be approved by lawmakers. Specifics of the bill are still under consideration. Along the same theme, the House Ways and Means Committee released a draft tax package that includes several new and expanded clean energy tax credits.
Development pipeline continues to grow
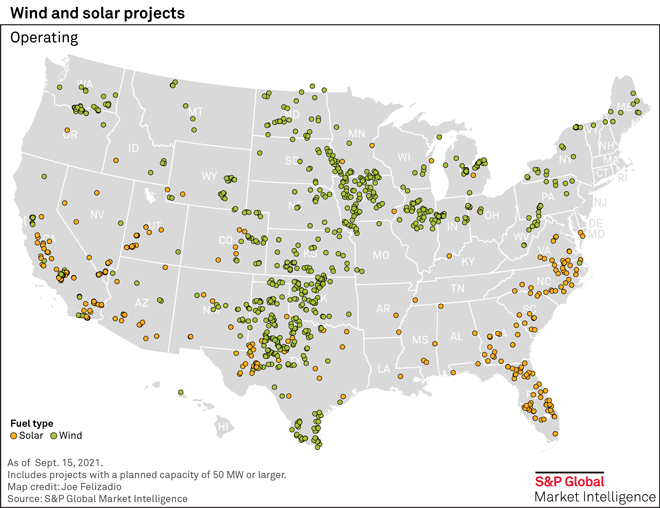
Thanks to declining costs, federal production and investment tax credits and state-level renewable portfolio standards, the wind and solar industry has made significant progress in the U.S. without the help of a federal mandate. As of end-2020, the U.S. had reached 170 GW of combined operating wind and solar capacity. The less prevalent, but typically eligible, clean energy resources of biomass and geothermal make up another 16 GW of operating generation. However, the current bill proposal excludes biofuels. The eligibility of hydroelectric, including pumped storage, and nuclear power as clean energy resources varies within different state RPS, but given their ability to reliably produce carbon-free generation, their role in the clean energy transition will not be trivial. Current operating capacity for these two resources is over 200 GW. A dedicated production tax credit for operating nuclear plants is in the current CEPP bill. Finally, battery storage, expected to be a critical asset class in the clean energy transition, continues to increase its footprint in the utility-scale energy sector. Nearly 3.4 GW of utility-scale storage are operating currently, which includes both stand-alone and co-located projects.
With the extension of the federal tax credits in December 2020, the near-term renewable development pipeline remains strong. To date, wind has dominated the utility-scale renewable market with 129 GW in operation compared with 55 GW of solar, but solar is flipping the script, with 142 GW of projects in various stages of development compared with 112 GW of wind. Storage is rapidly gaining traction in the utility-scale market with an estimated 35 GW of capacity in planning, fairly evenly split between stand-alone projects and storage paired with solar. The focus of this analysis is on the utility-scale energy sector; however, the distributed generation market will also play a key role in reaching any national clean energy goals. Installed distributed solar is estimated to be just over 30 GW currently.
Solar developers have flocked to Texas with over 40 GW of utility-scale in the pipeline within the state — nearly four times more capacity in planning than in Nevada. Aggressive RPS policy is driving strong solar interest in Nevada, California and New York, which rank second, third and fourth respectively in planned solar capacity behind Texas. States with low or non-existent RPS such as Ohio and Indiana, however, are seeing substantial upticks in solar development. Both states have just over 6,500 MW each of utility-scale solar in development.
Despite slipping behind solar in development capacity, wind remains a major market player. The top states in terms of planned capacity are a mix of non-RPS states like Texas, Wyoming, Oklahoma and Nebraska where wind resources and cheap land combine with the federal production tax credit to make wind a lucrative option for developers. Additionally, states with both aggressive RPS requirements and specific carve-outs for offshore wind, including New York, Massachusetts and New Jersey, are also leading the way.
Utilities not falling behind
While specifics of a national clean energy standard, or CES, still need to be ironed out, several energy providers have seen the writing on the wall and have implemented self-imposed carbon emission and renewable energy requirements. As of end-2020, of the 30 largest utilities in the U.S., 21 have implemented substantial decarbonization targets. Dominion Energy Inc. aims to reach companywide net-zero greenhouse gas emissions by 2050, while Duke Energy Corp. has a similar net-zero target and an interim target of 50% CO2 emissions reduction by 2030 relative to 2005 levels. Other top utilities, including Southern Co., Xcel Energy Inc. and Sempra, also have similarly aggressive decarbonization targets.
To meet these targets, several utilities are expected to invest millions in renewable energy over the next five years and beyond. Regulatory Research Associates' most recent capital expenditure outlook of some of the top utilities estimates nearly $14 billion will be allocated to renewable energy in 2021, bumping up to $14.5 billion in 2022. NextEra Energy Inc. is the clear leader among utilities in renewables capex investment with $12.4 billion planned in 2021 and 2022 combined. Avangrid Inc. is expected to spend $1.64 billion annually in renewable energy from 2021 through 2025 and is targeting a 35% emissions reduction by 2025 relative to 2015 levels en route to carbon-neutral operations by 2035. Duke Energy Corp. is planning to spend at least $1 billion in renewable energy annually through 2023.
Further, several utilities have announced new integrated resource plans, or IRPs, that heavily favor new renewable energy. Dominion Energy has submitted several requests for proposals for new solar projects in Virginia along with an associated IRP of 24 GW of new offshore wind, solar and energy storage by 2035 to help meet the state's recently implemented RPS mandates. Western U.S. energy provider and Berkshire Hathaway Inc. subsidiary PacifiCorp announced its 2021 IRP includes 3.6 GW of new wind and 5.6 GW of new solar along with plans to close several coal plants; a significant portion of the new solar projects will include battery storage as well. Midwest utility Evergy Inc., which aims to reach net-zero emissions by 2045, plans to add 3.2 GW of renewable generation by 2030 and another 4.5 GW of renewables by 2040. At this point, most utilities' new IRPs include robust future investment in renewable and clean energy resources.
Corporate renewables market ramping up
Increasingly ambitious clean energy goals from non-utility off-takers are also driving strong renewable growth both in the U.S. and around the globe. In 2020 alone, over 20 GW of corporate wind and solar capacity worldwide was tracked by Market Intelligence. Within the U.S. specifically, an estimated 45 GW of wind and solar capacity is contracted to corporate off-takers to date. Several major corporations, including several tech-industry companies such as Amazon.com Inc., Google LLC, Facebook Inc. and Microsoft Corp., have intentions to be 100% renewable by 2030 or even earlier. The manifestation of the corporate renewables market segment has helped drive new merchant wind and solar power in states like Texas, Illinois and Ohio. Further, utilities in regulated energy markets have caught on with the trend and implemented specialized programs to procure renewable energy for clean-energy-hungry companies in their footprint. This includes Dominion Energy subsidiary Virginia Electric and Power Co. in Virginia, Berkshire Hathaway subsidiary NV Energy Inc. in Nevada and Southern Co. subsidiary Georgia Power Co. in Georgia, which have active green tariffs or other similar structures in place.
Particularly ambitious companies like Google are looking beyond simply offsetting their annual energy consumption with matching renewable capacity in power purchase agreements and renewable energy certificate acquisitions by announcing their intention to go 100% renewable on an hourly basis. Google and Microsoft are leading this charge as both companies are aiming to go renewable on a 24/7 basis by 2030. Google recently announced an agreement with AES Corp. to reach this goal specifically for the company's data centers in Virginia, while Microsoft has a similar agreement with Engie Brasil Energia S.A. to reach its 24/7 renewable energy target. The success of these initiatives could lay the groundwork for the U.S. as a whole transitioning to 100% clean energy.
The current trajectory
These drivers are fostering strong near-term deployment of wind and solar generation. Nearly 45 GW of wind and solar capacity are anticipated to come online in 2021 alone, making it the most active year ever for renewables in the U.S. Just shy of 64 GW of new wind and solar are planned for both 2022 and 2023, surpassing the expected record total in 2021. Beyond 2023, incremental capacity expectations drop off quickly as the current schedule of tax credit phase-downs begins. Nevertheless, existing RPS statutes are forecast to drive substantial wind and solar installations through the decade, as Market Intelligence projects 91 GW and 43 GW respectively need to be installed by 2030 just to meet RPS targets across 30 states. The pipeline of projects surpasses this total, and even states with the most aggressive targets such as New York, California and Virginia are more or less on track to keep pace with interim renewable mandates over the next five years.
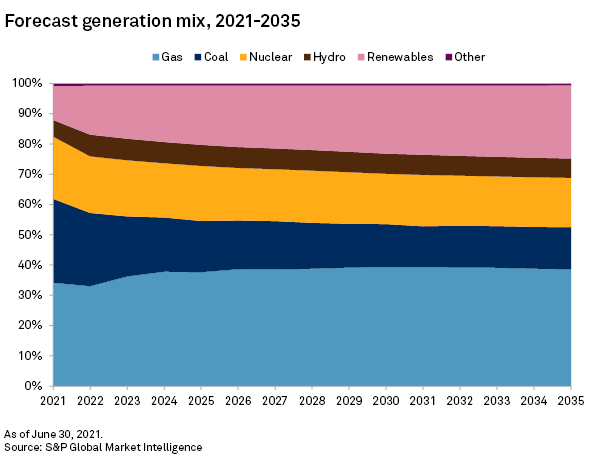
Despite the multitude of drivers in place for renewables, the current trajectory of clean energy generation in the U.S. falls well short of the 80% target currently under discussion, and the deficit relative to meeting the goal of complete decarbonization of the energy sector by 2035 is even larger. Market Intelligence forecasts renewable generation to account for less than one-quarter of U.S. generation by 2030, and this proportion is expected to creep slowly higher through 2040. While this projection is almost certainly a conservative one — expected increased demand for corporate renewables and the likely enactment of more widespread and more aggressive RPS legislation are not factored in — it still shows the considerable gap between the current "business-as-usual" scenario and the scenario needed to put the U.S. on a path toward reaching 80% clean energy by 2030.
When adding hydroelectric and nuclear generation, total carbon-free generation is expected to make up just under 45% of the overall mix by 2030, and this increases to 47% by 2035. Current market conditions and grid reliability requirements keep natural gas and coal generation firmly in place for the foreseeable future, with the two resources accounting for at least half of U.S. electricity generation over the next 20 years. The passing of a national CES, along with a necessary enforcement mechanism, will upend this trajectory entirely. Though fast-start peaking natural gas plants will be needed as variable renewable generation grows, baseload natural gas and especially coal will need to be quickly phased out, leading the way for significantly increased investment of wind, solar and other clean energy sources.
Decarbonizing electricity: how much new investment is needed?
To assess the potential investment impact of implementing the proposed CES, Market Intelligence modeled the capacity expansion necessary to meet the electricity requirements using commercial wind and solar generation. While the final form of the CES may fail to progress or may change substantially, current proposals call for an 80% reduction in CO2 emissions from generation by 2030, increasing to 100% by 2035. The first year in which a compliance target is specified is 2023. Market Intelligence forecast against these targets for the Eastern Interconnect and the Western Interconnect, pre-empting existing RPS but maintaining generating fleet disposition and load projections as of June 30, 2021, including approximately 92 GW of wind and 43 GW of solar estimated to be in place by year-end in the Eastern and Western Interconnects. Market Intelligence focused this modeling effort on projections of additional solar and wind capacity needed to achieve these targets and the aggregate impact on generation from the existing coal and natural gas power plant fleet.
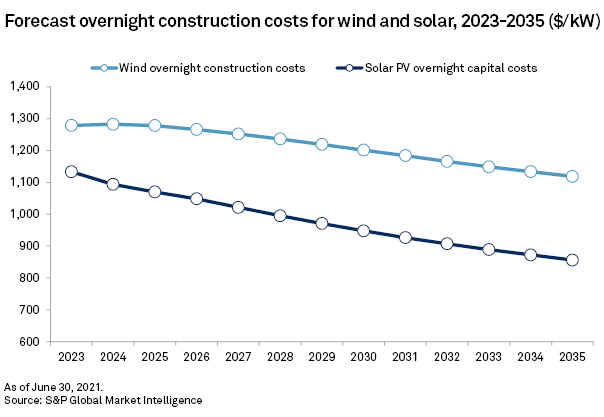
Over the next 15 years, improving economies of scale are expected to reduce the capital costs of wind and solar technologies, potentially easing the cost burden of implementing the proposed CES. While a higher overall generation profile benefits the expansion of wind to meet the CES, the cost advantage of new solar may make it more economical to use in markets where solar penetration is currently low.
While these assumed costs drive the model estimates and projections of total compliance costs, it is possible that an investment of this level could influence the total cost, with additional economies of scale and technological improvements offset by increased costs due to increased demand for input commodities potentially creating supply chain bottlenecks.
Capacity addition and cost result
Regardless of the mix of zero-carbon resources deployed to achieve the CES, the scale of new investment will need to be large. Market Intelligence estimates that by year-end 2022, fossil generation will constitute roughly 57% of the Eastern and Western interconnects, with a need to reduce this amount by 6% annually to achieve the 2030 benchmark. In terms of total capacity, this may require greater fleet turnover in the near term than the push to achieve full decarbonization after 2030.
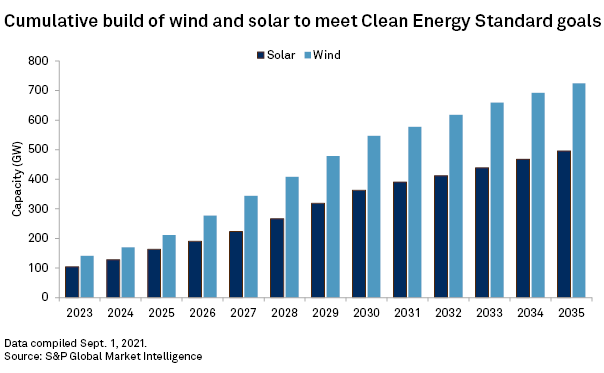
Market Intelligence projects that wind investment would need to accelerate in the near term due to aggressive compliance targets, with investment shifting to solar as its cost advantage grows after 2030. By 2030, Market Intelligence estimates a total investment of 450 GW of new wind and 320 GW of new solar, essentially building an entirely new generation fleet by adding 85 GW per year of zero-carbon generation. The investment grows to a total of 630 GW of wind and 450 GW of solar by 2035, requiring an aggregate direct investment of $1.2 trillion, or $94 billion annually, over 2023-2035.
For comparison, Market Intelligence estimates the aggregate firm new build in the U.S. at 63 GW over the next two years, an estimate that includes the fast-growing Electric Reliability Council of Texas region. This implies that annual zero-carbon construction would need to expand by 30%-50% to meet CES targets.
Fossil generation, not surprisingly, is projected to decline substantially as green energy is added to the system under the CES. Market Intelligence projects that coal and natural gas combined-cycle generation would decline by two-thirds from 2023-2030 and more slowly thereafter. Natural gas peaking generation would slightly increase in order to supplement the variable renewable resources of the future.
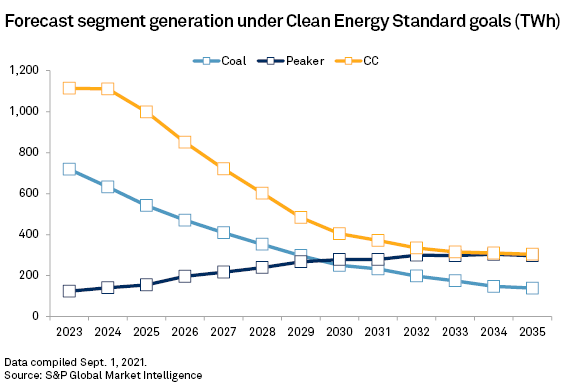
Notably, these forecast declines in generation do not result in an 80% emissions reduction or in full decarbonization. Simple expansion of solar and wind resources in this forecast results in a combination of displaced fossil generation but also curtailed renewable generation. The fossil fleet remains available for generation in limited hours, as seen by the increased generation from natural gas peaking units and the retention of coal and combined-cycle plants for generation. The potential for curtailment of green energy grows significantly as national targets approach levels needed for 80% emissions reduction. With no offsets to curtailed generation, Market Intelligence forecasts only a 55% reduction in carbon dioxide emissions by 2030, expanding to 68% by 2035. These compare to an approximately 13% reduction in CO2 emissions by 2035 expected based on current forecasting absent a CES.
High amounts of curtailment indicate additional investment will be required to minimize wasted generation or overbuilt capacity. Expansion of battery storage is expected to play a substantial role in addressing curtailment, particularly if the segment adds longer-duration options than are currently available with lithium-ion batteries. Additional investment may include green hydrogen, demand-side measures, distributed green energy or more dispatchable forms of zero-carbon energy.
Absent further expansion of recently emerging technologies, the intermittent nature of wind and solar may result in retaining legacy fossil generation. Market Intelligence forecasts that 140 GW of fossil capacity would retire under a CES scenario, but the need to backfill intermittent green energy could lead to the retention of over 480 GW of the current fleet, which would delay full decarbonization.
Furthermore, decarbonization mandates have the potential to come into conflict. The Biden administration's pledge to increase electric vehicle sales to 50% of all car sales by 2030 implies significant expansion of electricity use in transportation. While the expansion of battery EVs could beneficially absorb generation that might be curtailed otherwise, overall demand for green energy appears likely to be higher than projected as a result.
Meeting the requirements of the proposed CES would entail an unprecedented expansion of the nation's wind and solar generating fleets. While such a rapid expansion is possible, curtailment risk could slow progress toward decarbonizing the electricity sector. This further challenge could be addressed with additional investments in emerging technology, but it implies that the mix of technology options needs to be wider than what is available today:
- Battery storage, currently in deployment, can help, but diversity of options regarding cycling and duration likely needs to increase and costs of storage would need to continue to decline.
- While the deployment of wind and solar generation has been impressive, additional zero-carbon generation options, including geothermal, expanded hydroelectric, offshore wind, or the next generation of nuclear power, need to be added.
- Carbon emissions abatement options, including capture and sequestration and direct-air capture, may need to expand.
While the scale of investment is significant, it parallels other historical periods where infrastructure needed to catch up with the needs of societies and their markets. Infrastructure for energy systems is necessarily more capital-intensive than consumer technologies but mobilizing the capital to decarbonize electricity in a way that supports climate goals and delivers benefits to the economy can be done over the next 15 years.