
2023 was another very busy year for activists, as they launched a total of 1,151 campaigns, up slightly from the full-year 2022 total of 1,083. ESG continues to be a prominent theme, making up 82% of campaign objectives in 2023. This could already be surpassed in 2024[1] with 174 campaigns launched year-to-date vs. 144 campaigns in 2023.
The Take
Nelson Peltz is the founder of Trian Fund Management, a multibillion-dollar asset management firm headquartered in New York City. On January 18, 2023, he put his name forward to sit on the Board of Directors of The Walt Disney Company due to perceived poor performance and strategy execution following the retirement of the visionary CEO Bob Iger. He, and others, were dissatisfied with the running of the streaming business and Bob Chapek, the newly appointed CEO, who had little experience working with creative content departments. How can Investor Relations (IR) teams and others identify such unexpected shareholder movement on a real-time basis and understand the motivations of those buying and selling a company's stock?
Gain real-time visibility into the actions of activists
Understanding the actions of activists in today’s dynamic market is essential for companies attempting to evaluate their full economic exposure. Specialists at S&P Global Market Intelligence analyze $89 billion in activist equity assets daily to facilitate industry-leading portfolio visibility and best-in-class pattern recognition to track the who’s-who of shareholder activism.
As seen in the screenshots below, by tapping into our investor activism intelligence users can understand activists with the highest shareholding in a company and track campaigns against a target company at either a campaign or company level. Here, Trian’s $500 million stake in Disney highlights the potential intent to influence the company’s strategy on a more hands-on basis.
Activist ownership and campaign timeline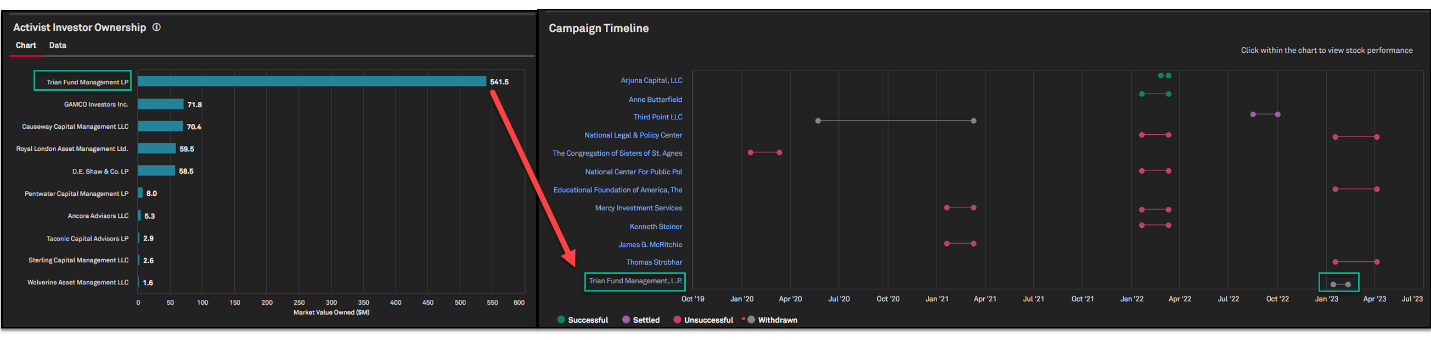
Source: S&P Global Market Intelligence. For illustrative purposes only.
Activist profile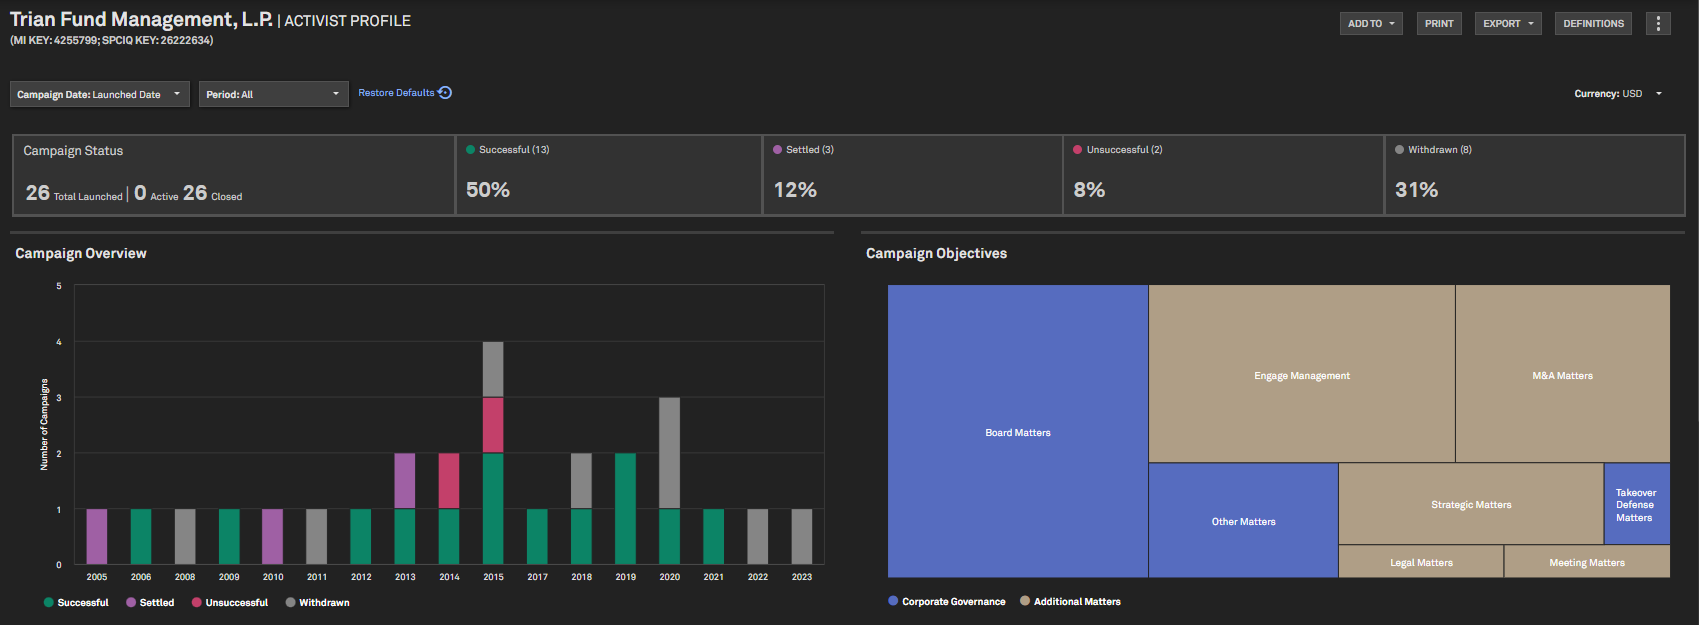
Source: S&P Global Market Intelligence. For illustrative purposes only.
Assess the impact of a campaign
Different campaigns will have different impacts on the valuation and share performance of a company. Users can quantify how material a campaign is by leveraging our “Key Developments” dataset and market data. As seen in the annotated stock chart below from the “Announced” to “Withdrawn” date, Trian’s campaign against Disney moved the share price higher in anticipation of a new restructuring plan.
Campaign impact on stock performance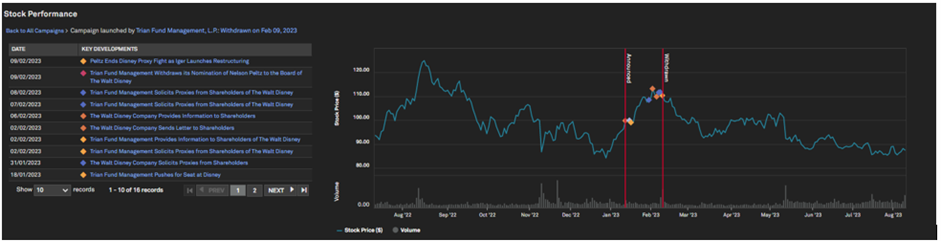
Source: S&P Global Market Intelligence. For illustrative purposes only.
As quoted in the Key Development details below, “Peltz stirred the pot for what appeared to be a boardroom battle brewing at the Magic Kingdom after he demanded the company reorganize and focus on creativity, while criticizing its bungled succession planning.” Trian’s campaign against Disney was one of the many catalysts prompting the retired Bob Iger, 72, back into the CEO position to restructure a new plan for Disney’s streaming business and overall creative content.
Key Developments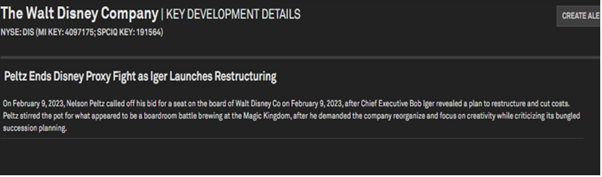
Source: S&P Global Market Intelligence. For illustrative purposes only.
Customize annotations and key developments
Our “Chart Builder” enables users to be more bespoke in their approach to mapping out share price performance over time by using an array of key development categories (e.g., CEO/Executive Change), as well as custom annotations.
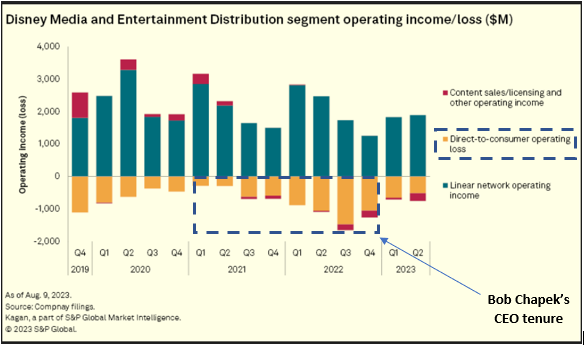
The yellow line on the screenshot below marks the end of Q1 2021, which was when most economies across the world began to fully open after the COVID 19 pandemic. Bob Chapek’s first few quarters as CEO were during the pandemic when streaming demand was highest with consumers at home thus increasing the share price. However, there was a sharp drop in Disney’s shareholder value from Q1 2021 onwards as lockdown restrictions eased and people returned to work and socializing outside the home.
In November 2022, Bob Iger was reappointed to the CEO role to steer Disney back on track after Bob Chapek’s tumultuous tenure, with share prices rising shortly thereafter before levelling off.
Custom analysis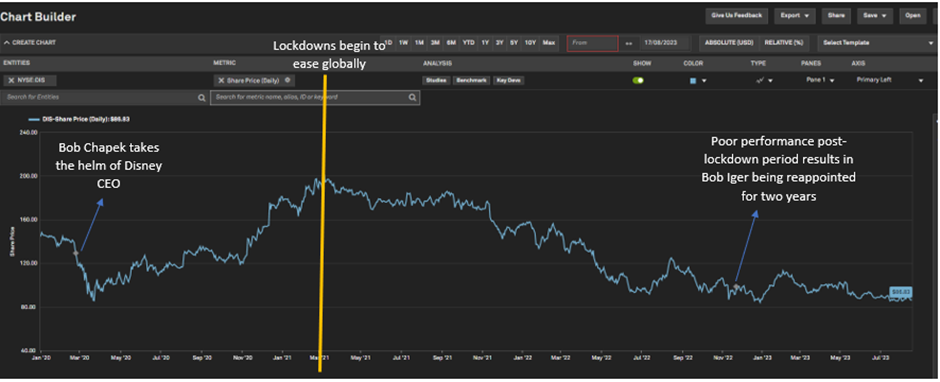
Source: S&P Global Market Intelligence. For illustrative purposes only.
Do a deep dive on sentiment analysis
Different filing types, broker reports, transcripts, and investor presentations can uncover additional insights to get the full picture of a campaign. Our powerful AI-driven search tools, such as “Document Viewer”, helps users quickly find relevant information within our large array of qualitative data sources.
For example, the highlighted section of a Disney proxy filing below uncovers perceived weakness in one of the company’s Board members. It states: “the Trian Group believes Mr. Froman has no experience as a public company director outside of Disney and, moreover, has served as a member of the Governance and Nominating Committee of the Board, which the Trian Group believes has overseen weak corporate governance at the company.”
Filing details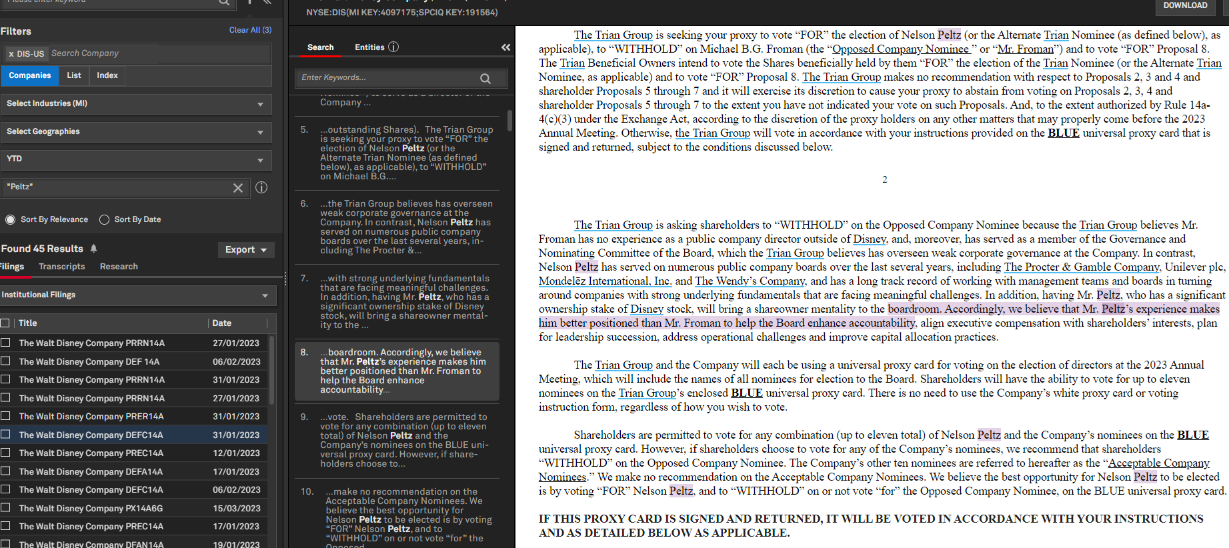
Source: S&P Global Market Intelligence. For illustrative purposes only.
Users can also access comprehensive professional profiles to understand the background and experience of individuals at the helm of the world’s largest companies and how their expertise may have influenced corporate governance and business strategy.
Professional profile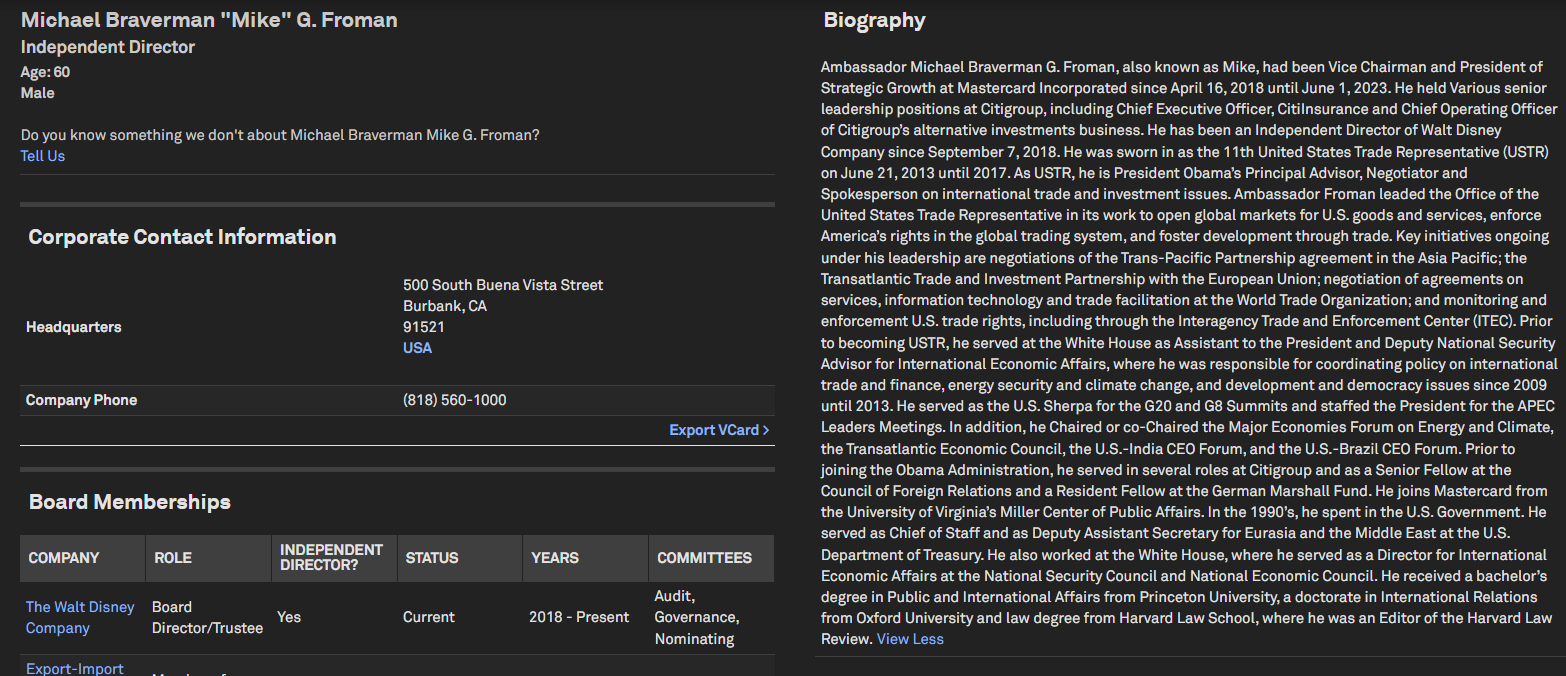
Source: S&P Global Market Intelligence. For illustrative purposes only.
Understand industry trends and company performance
An analysis of industry trends and company performance can provide an important context for the developments taking place. We provide extensive industry-specific research to help users understand the dynamics and the factors driving ongoing changes at a company level.
Company insights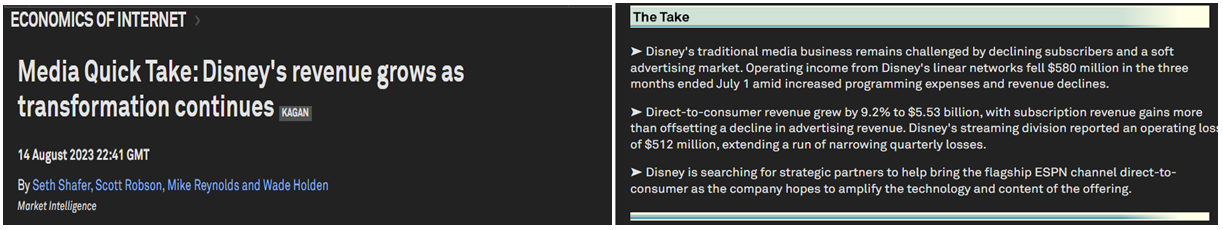
Source: S&P Global Market Intelligence. For illustrative purposes only.
Get critical activism insights
Investor Relations (IR), corporate development, legal, sustainability, and many other professionals need to be aware of the actions of activist investors as the number of campaigns begins to rise. Investor activism intelligence that identifies who has been actively buying or selling a company's stock and provides actionable insights into how investor behaviour impacts equity prices can point to potential red flags or business development opportunities.
Disney (NYSE:DIS) Investor Activism Summary Page
Trian Fund Management LP Activist Profile
Peltz Ends Disney Proxy Fight as Iger Launches Restructuring (Key Development Page)
Custom Chart Builder with Annotations
Michael Froman (Disney Board Member Profile Page)
Media Quick Take: Disney's revenue grows as transformation continues (Kagan Research)
[1] Year to date: 01/01/2024 to 06/03/2024.