
Introduction
Renewable energy production in the U.S. is poised to double by the mid-2020s based on an analysis of currently operating and planned capacity. The near-term outlook, however, shows legacy fuels firmly ensconced in the national output's driver's seat as renewables, though riding a massive wave of planned capacity, contend with generally less competitive capacity factors.

The U.S. renewables, notably solar and wind, buildout is arguably not fast enough to address energy concerns around geopolitical developments, including corollary inflation levels.
Less competitive solar and wind capacity factors compound the issue. Even with renewables potentially reaching a third of the U.S. utility-scale portfolio based on current operating and planned capacity, we estimate that energy production from renewables would account for less than a quarter of the overall U.S. output.

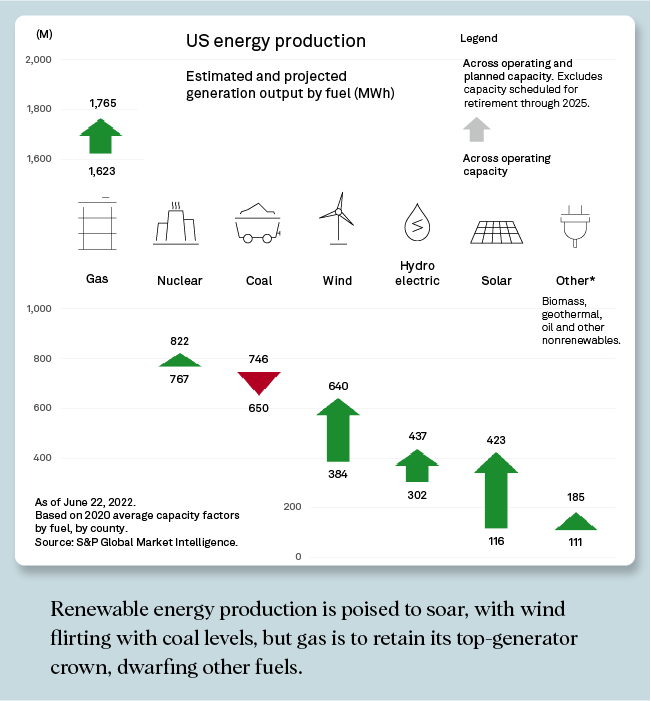
Our study suggests the share of U.S. generation output from renewables, including biomass, geothermal, solar and wind, could rise to 23%, up from 14% today, as renewable electricity production jumps more than 98% to approximately 1.2 billion MWh. Fossil fuel production should stay flat at roughly 2.4 billion MWh, but we expect the share of the category in the production mix to dip below 50%, down from an estimated 59% currently.
Gas is to retain the top-generator crown, despite a 4 percentage point decline, with nuclear holding on to the number two spot. According to our analysis, coal and wind are neck and neck for third place, at 13.2% and 13%, respectively, suggesting wind is on the verge of overtaking the legacy carbon-heavy fuel in U.S. electricity production. With the conflict in Ukraine and its geopolitical repercussions upsetting long-term energy transition strategies, however, retirement plans for CO2-emitting plants could be put on hiatus.
Utility-scale solar energy production is to nearly quadruple, reaching a share of the national output in high-single-digit territory. Currently, the U.S. operates close to 66 GW of utility-scale photovoltaic capacity and has an additional 187 GW in the pipeline. Combining operating and planned capacity levels shows that utility-scale solar is catching up fast to the U.S. wind portfolio, which stands at 258 GW when including capacity in operation and in the pipeline. Averaging about 24% nationwide in 2020, however, solar capacity factors markedly trail their wind counterparts, hovering around 35% in 2020.
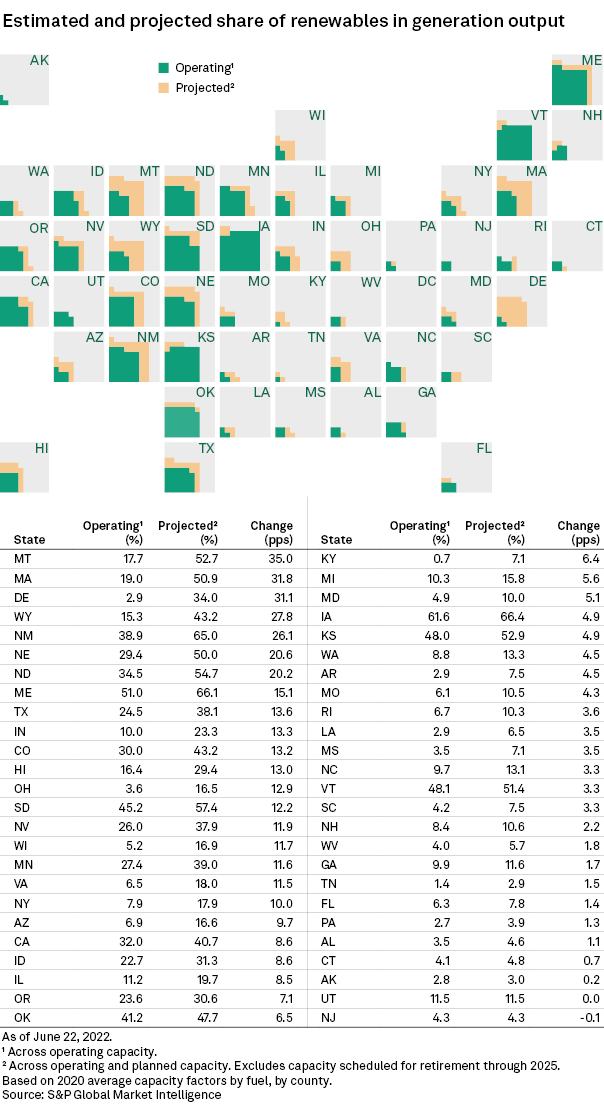
At the state level, we expect the anticipated shifts in renewable and legacy fuel capacity to result in 10 states producing at least 50% of their energy from renewables, versus only two — Iowa and Maine — today. Post-planned capacity, Iowa, Maine and New Mexico should generate about two-thirds of their output from renewable sources. With respective jumps of 35 and 32 percentage points, we expect Montana and Massachusetts to log the largest increases in the share of renewables in overall electricity production.
Delaware rounds out the top three. With a pipeline pointing to a 22-fold increase in renewable capacity, the share of renewables in Delaware's generation output could potentially rise by 31 percentage points to 34%. The First State has a targeted renewable portfolio standard of 40% renewable energy by 2035. We estimate that gas accounts for over 90% of the state's energy production.
The Southeastern U.S. is overly represented in states trailing in renewable generation. Among the 13 states anticipated to produce less than 10% of their energy from renewables based on operating and planned capacity, nine are in the region, with Tennessee bringing up the rear at less than 3%. Tennessee favors nuclear and hydroelectric production to limit carbon emissions. The Volunteer State ranks fourth in the country in percentage of energy production from nuclear, behind New Hampshire, Illinois and South Carolina. Combined, nuclear and hydroelectric account for more than 60% of Tennessee's generation output.
Modeling the evolution of overall U.S. generation output by fuel type in the near term involved a two-step process. First, for each fuel type, we calculated a weighted average capacity factor at the county level based on S&P Global Market Intelligence's power plant and capacity factor data as of 2020.
Second, we applied those weighted averages to the U.S. capacity in operation and in the pipeline across corresponding fuels and counties. We then aggregated the energy production results at the state and national levels. Note that with 2025 being the most distant known online year for projects in various stages of development, the analysis took into consideration scheduled retirements of non-renewables plants from 2022 through 2025 at the time of writing.
The definition of renewables in this article does not include hydro or nuclear, which are often counted as zero-carbon fuels. All biomass units are included as renewables, though that definition can vary in the state renewable portfolio standards. See the attached excel spreadsheet for a full breakdown of the results.
Regulatory Research Associates is a group within S&P Global Commodity Insights.
This article was published by S&P Global Market Intelligence and not by S&P Global Ratings, which is a separately managed division of S&P Global.