
Introduction
U.S. and Canadian photovoltaic power generation logged a third straight quarter of solar radiation above the norm in the three months to June 30. Operating utility-scale solar projects across the U.S. and Canada experienced a weighted average 1.8% deviation, presaging solid second-quarter earnings among major solar operators in the region.

In the second quarter, the utility-scale solar energy sector in the U.S. and Canada grew operating capacity by nearly 2% sequentially and benefitted from an extended streak of above-normal solar radiation, intimating an earnings boost for the three-month period on theoretically higher generation.
All top 20 owners of U.S. and Canadian solar capacity experienced solar radiation above the 20-year norm, with projects in the Northeastern U.S. logging particularly dramatic deviations.

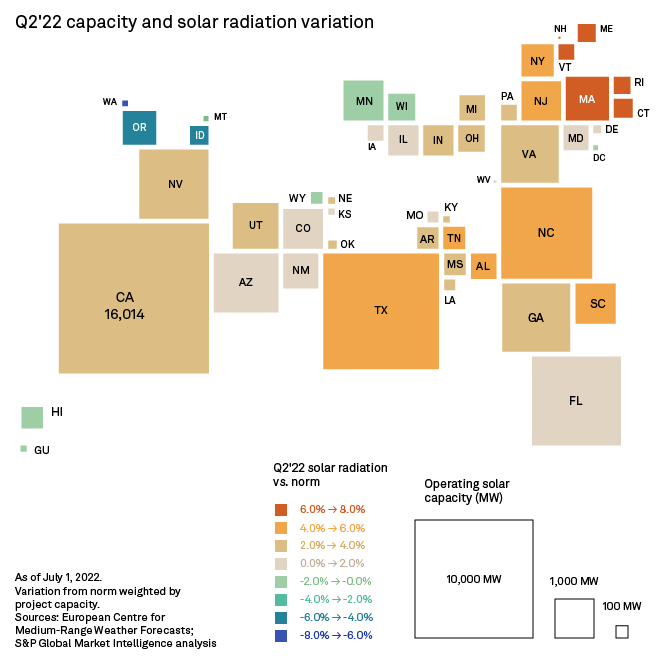
Led by a particularly sizzling Northeast, with New England states notably seeing radiations of more than 7% above the 20-year norm, most of the U.S. basked in extra sun during the period. Only a handful of Western states and Minnesota and Wisconsin bucked the trend. Washington state and Oregon brought up the rear, experiencing negative deviations of 7.7% and 5.4%, respectively.
An expanded U.S. and Canadian utility-scale solar capacity compounded the benefits of the period's above-normal radiation. Combined, the two North American nations' operating utility-scale photovoltaic portfolios came in at nearly 68 GW at the end of the period, up nearly 2% sequentially and more than 11% year-to-date. For perspective, this compares to nearly 153 GW of wind capacity in operation across 43 U.S. states and Canadian provinces. The wind sector also received an extra boost from Mother Nature in the second quarter.
NextEra Energy Inc. continues to boast the largest utility-scale solar portfolio across the geography. With 8.6 GW in operation, NextEra distances number two Consolidated Edison Inc. and its 2.9 GW by a significant margin. With most of its solar assets in Florida, California, Georgia and Nevada, NextEra typically capitalizes on some of the most optimal solar conditions in the U.S.
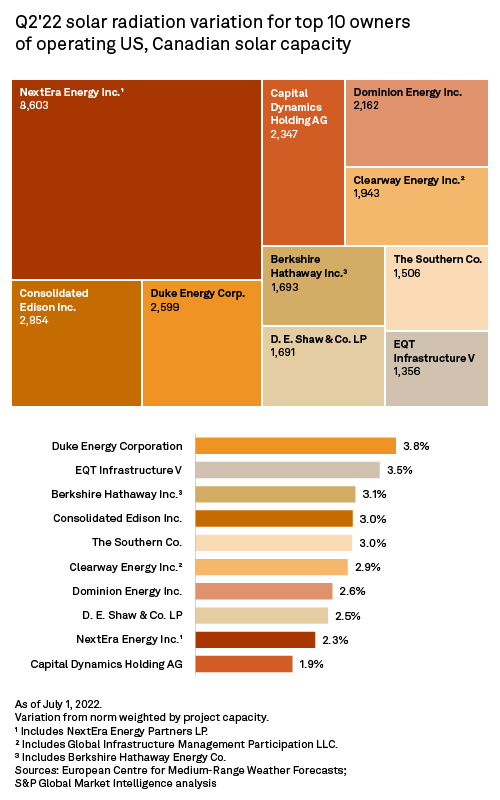 |
That said, Florida, NextEra's largest U.S. state by solar capacity with nearly 44% of the company's solar portfolio, saw solar radiation deviate by only 1.9% in the three months ended June 30, ranking 29th on the U.S. solar deviation charts for the quarter. NextEra owns a wide array of 75-MW solar projects in Florida, including the Babcock Ranch Solar Energy Center, which powers the environmentally friendly town of Babcock Ranch in southern Florida. Babcock Ranch Solar Energy experienced a 2% solar deviation in the second quarter.
In California, NextEra's second-largest U.S. state by solar capacity, radiation deviated 2.7% from the 20-year norm, with gains across NextEra projects in the Golden State ranging from 1% at the McCoy Solar Energy Project to 4.2% at the Westside Solar Project (Wonderful Orchards). NextEra's California-based Arlington Energy Center II, which saw solar radiation 1.1% above normal in the second quarter, has a long-term fixed monthly average transaction rate of $20.64/MWh, according to first-quarter 2022 S&P Global Market Intelligence quarterly transaction data.
Not too far removed from the number two solar-portfolio spot, Duke Energy Corp., with roughly 2.6 GW of owned solar capacity, experienced the largest portfolio-wide solar radiation deviation across the top 10 owners of solar capacity in the U.S. and Canada. Three states, Florida, North Carolina and Texas, account for nearly 82% of Duke Energy's solar portfolio. Duke solar projects in Texas experienced particularly dramatic gains. At Niagara Bottling - Seguin Solar Project and East Blackland Solar Project 1 (Pflugerville Solar Plant), for example, solar radiation deviated by more than 8%.
Duke Energy, through its subsidiaries, has power purchase agreements with four fellow top 10 owners of operating solar capacity in the U.S. and Canada, contracting more than 1.4 GW of solar capacity with Capital Dynamics Holding AG, D.E. Shaw & Co. LP, Dominion Energy Inc. and EQT Infrastructure V.
Duke Energy Progress LLC's power purchase agreement with Dominion Energy's Innovative Solar 37 Project, through which Duke contracts 79 MW, is the largest. Solar radiation at Innovative Solar 37 deviated 3.6% from the norm in the second quarter. The project has a fixed monthly average transaction rate of $45.91/MWh.
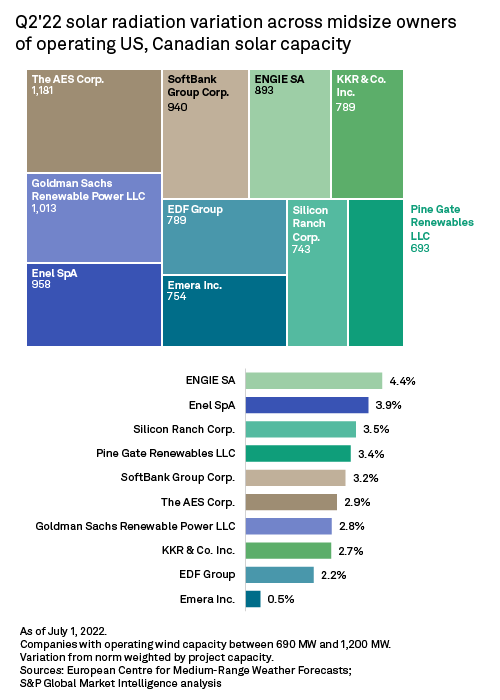 |
Across the midsize operator space, or companies holding between 690 MW and 1,200 MW of solar capacity, portfolio-wide solar deviations from the norm ranged from 0.5% to 4.4%. Engie SA led the pack; Emera Inc. ranks at the bottom of the group. AES Corp. and Goldman Sachs Renewable Power LLC, which own the largest amount of operating solar across this segment, logged portfolio-wide solar radiation deviations just shy of 3%.
In the second quarter, SoftBank Group Corp. joined the club of top 20 owners of utility-scale photovoltaic capacity. The company doubled its solar capacity sequentially with the additions of 300-MW Juno Solar (Intersect Power) and 180-MW Aragorn Solar Project in Texas. Overall, the Softbank Group solar portfolio experienced solar radiation 3.2% above the norm in the three months ended June 30. As of this writing, Softbank had an additional 1.4 GW of solar capacity in the pipeline, of which 79% are planned in highly insolated Texas.
Solar radiation is the mean surface downward short-wave radiation flux measured from the fifth-generation European Centre for Medium-Range Weather Forecasts reanalysis. This variable includes direct and diffuse solar radiation and is the model equivalent of global horizontal irradiance, the value measured by a pyranometer, a solar radiation measuring instrument. The data is available at quarter-degree latitudes and longitudes, a spacing of slightly over 27.5 km. This analysis compares second-quarter radiation values with the 20-year solar radiation average for the corresponding period.
Regulatory Research Associates is a group within S&P Global Commodity Insights.
Kristin Larson, Dred Semodio and Chris Allen Villanueva contributed to this article.
This article was published by S&P Global Market Intelligence and not by S&P Global Ratings, which is a separately managed division of S&P Global.