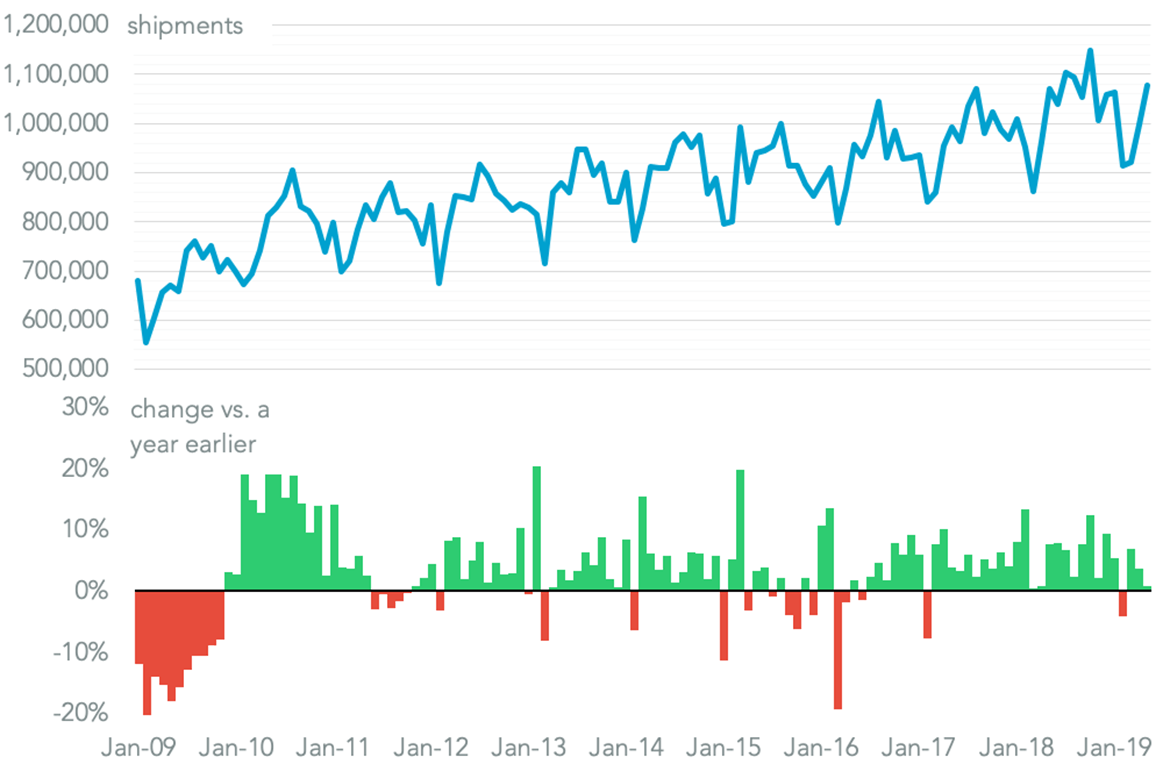
The steady growth of U.S. imports likely continued in May. Panjiva data shows U.S. seaborne imports climbed 0.8% year over year in May, with containerized freight specifically having increased by 3.0%. That means there's only been two down months (Feb. 2017 and Feb. 2019 for seasonal reasons linked to Asian holidays) during the Trump administration.
Learn more about Panjiva Supply Chain Intelligence
Click Here26 OUT OF 28 AIN'T BAD

Chart shows U.S. seaborne imports. Source: Panjiva
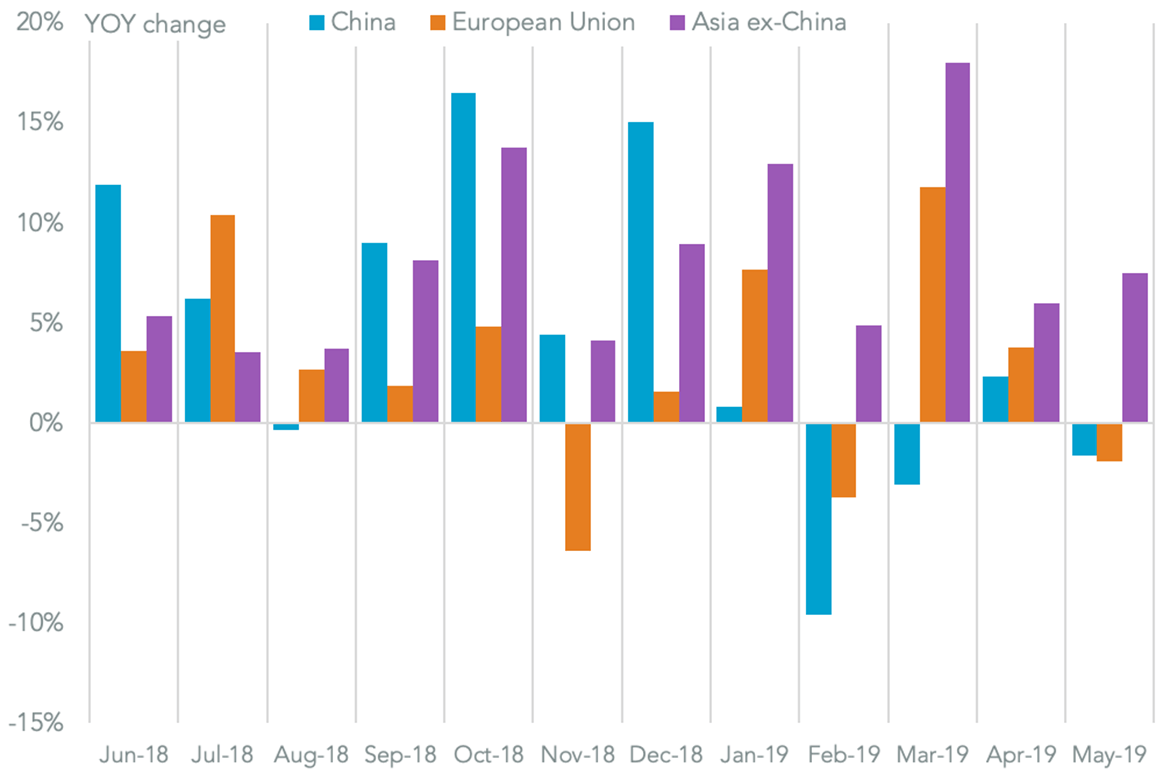
Imports from China fell 1.6% despite a potential rush in shipments to beat an increase in tariffs. That chimes with what's been seen in the Chinese government's macroeconomic data as outlined in Panjiva's research of Jun. 10.
The loss of imports has been partly offset by shipments from Vietnam, which climbed 19.5% year over year, as well as a 9.0% rise in shipments from India which brought the Asia ex-China imports up by 7.5%.
Shipments from the European Union fell 1.9% following on from growth of 4.2% in the prior three months. There appears to have been little impact from the weakening trade relations between the EU and U.S. governments despite the prospect of the implementation of auto tariffs in November.
ASIAN EXPLOSION ALLOWS IMPORTS TO BLOW PAST CHINA DECLINE

Chart segments change in U.S. seaborne imports by origin. Source: Panjiva
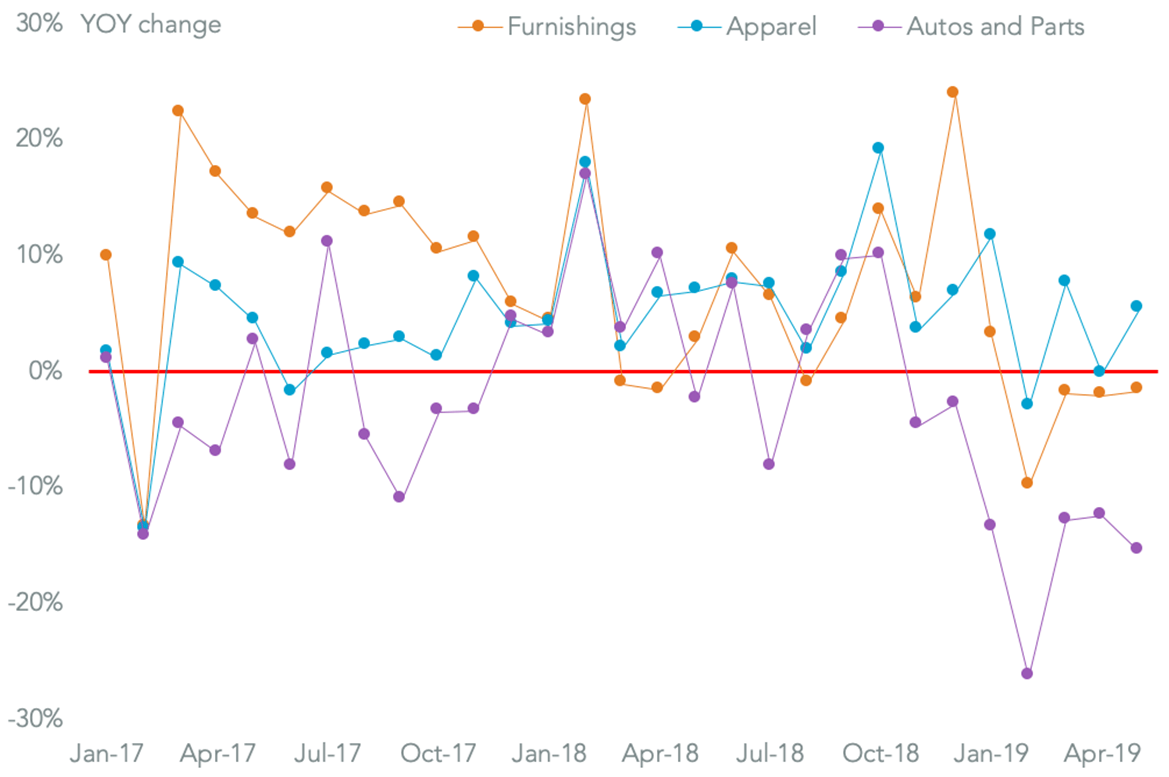
Seaborne imports linked to the autos sector have been in decline anyway with shipments down 15.6% in part due to weak automotive sales foreign of light trucks which fell 7.1% and cars which slid 2.5% lower.
Among other consumer discretionary sectors there was a 1.7% drop in imports of furniture, marking the fourth straight downturn as tariffs begin to take a bite out of sales. By contrast apparel imports rose 5.3% from 0.9% in the prior three months, which may be indicative of accelerated shipments should the Trump administration's threat to increase tariffs on all Chinese exports come to fruition.
There was even evidence of acceleration shipments of toys too with an 8.2% though seeing manufacturers start to rush through deliveries, South China Morning Post, even though we're currently in the trough season for shipments
SMALLS BEAT BIG TICKET ITEMS

Chart segments change in U.S. seaborne imports by product (HS-2) for furniture, apparel and autos. Source: Panjiva
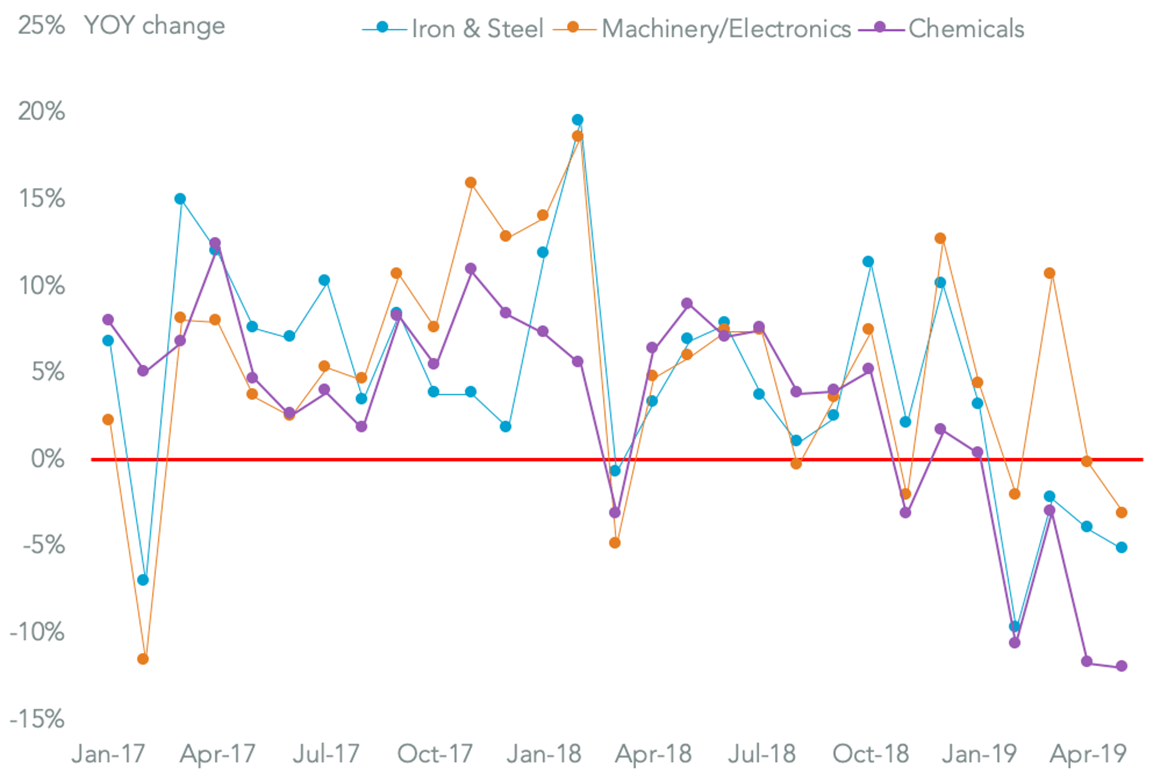
The pattern was more evenly negative in the industrial sectors. Imports of steel fell for a fourth straight month with a 5.3% drop year over year in May. Seaborne imports could fall further if the newly removed tariffs on Mexico and Canada improve the competitiveness of those countries.
The Trump administration's commodity policies also resulted in declining energy imports with a 3.6% decline marking the eighth straight month of falling imports.
A wider weakness in industrial demand can be seen in a 3.2% slip in capital goods broadly (HS 84/85) as well as a 12.0% slump in imports of chemicals. There's likely to be more of the same in the coming months - depending on the vicissitudes of administration policy - given the ISM survey of imports has reached its lowest since Jan. 2017.
INDUSTRIAL IMPORT DOWNTURN NOW LOOKING SYNCHRONIZED

Chart segments change in U.S. seaborne imports by product (HS-2) for steel, capital goods and chemicals. Source: Panjiva


