
An ambitious state renewable portfolio standard, increasing datacenter loads and expected offshore wind additions impact zone prices and capture ratios for wind and solar at Virginia's Dominion Hub. S&P Global Market Intelligence Power Forecast projects the solar capture ratio will decrease as renewable penetration increases in the state.

Capture ratios explained
➤ As the energy transition drives rapid changes in generation fleet composition, the electric industry is increasingly focused on measuring current financial performance and market prospects for green generation. Capture ratios are one useful metric in assessing the financial viability of different types of generation.
➤ Capture ratios lower than one means the price received for the renewable generation was lower than the around-the-clock zone price. As wind and solar increase their generation in a zone, the price may fall in the hours those resources generate, creating capture ratios lower than one. S&P Global Commodity Insights analysis of current and future capture ratios indicates that, despite high levels of policy support, market risks remain for zero-carbon generation and may increase over time. These risks will likely vary across different markets, depending on the current generating mix and the type of policies in place. This series considers capture ratios in three electricity markets: ERCOT, PJM Interconnection LLC and California ISO.
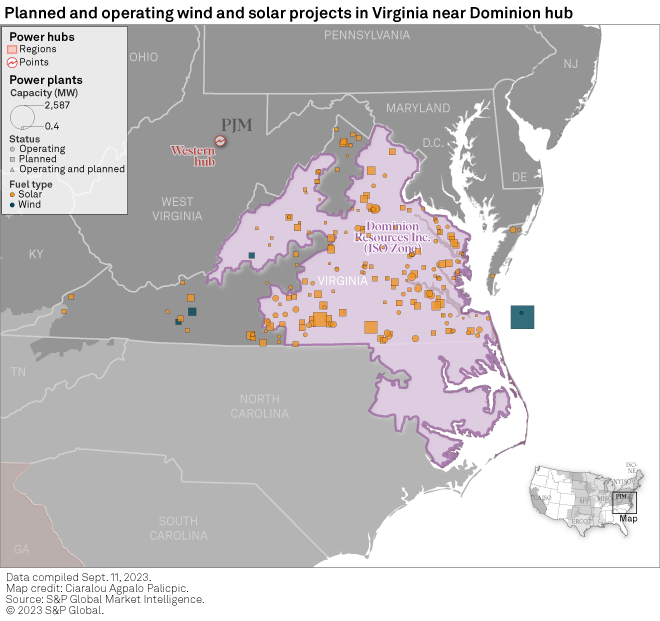
Virginia's Clean Economy Act requires investor-owned utilities in the state to source 100% of their electricity from renewables by 2045 (Virginia Electric and Power Co.) or 2050 (Appalachian Power Co.). It also mandates 2,500 MW of offshore wind by 2029, growing to at least 5,200 by 2035. Dominion Energy Inc.'s 2.6-GW Virginia Beach Offshore Wind Project (Coastal Virginia Offshore Wind) alone would surpass the state's 2029 offshore wind target, with the project scheduled to come online in December 2026. We forecast an additional 1,300 MW of offshore wind capacity online in 2030, allowing Virginia to meet its 2035 offshore wind target.
Wind energy generation accounted for 3% of the total in PJM in 2021. Power Forecast expects the metric to rise to 4% by 2024, 14% by 2028 and 22% by 2032. Zooming in on the Dominion territory, forecasts for the share of wind in the generation mix are closer to 20% in 2028 and 30% in 2032.
The rapidly growing load in PJM combined with Virginia's aggressive renewable portfolio standard will result in the building of significant amounts of solar and wind capacity in the region, according to Power Forecast. The share of solar grows in the forecast from 1% in 2021 to 2% in 2024, 8% in 2028 and 12% in 2032. In Dominion, solar tops 20% in 2028 and 2032.
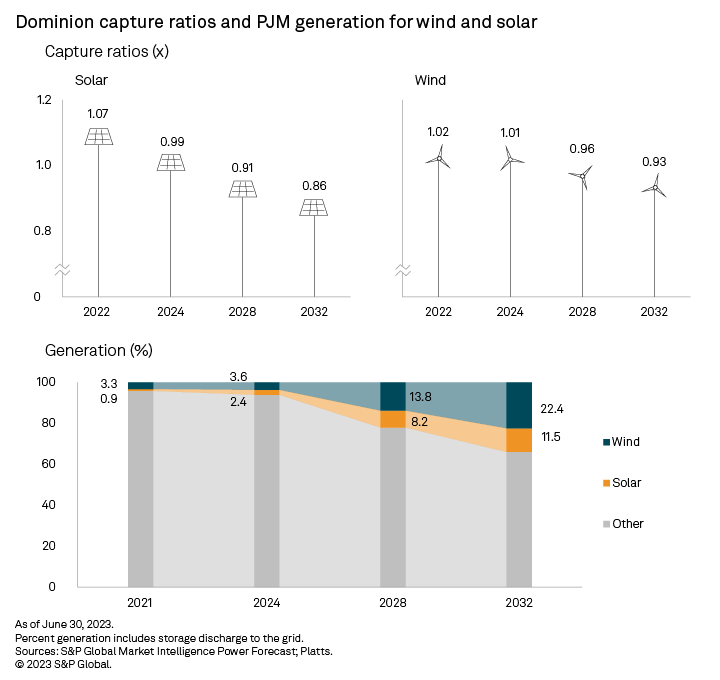
Combined, wind and solar generation in the Dominion territory is projected to make up 10% of the total in 2024, rising to 44% in 2028 and 61% in 2032. This increased renewable generation strongly affects the shape of the price curve, changing the timing of peak prices from afternoon and evening in 2024 to after sunset and before sunrise in 2028 and 2032. See the illustration below.
Wind and solar projects do not generate equally at all hours of the day. Forecast daily power production in July 2028 in Dominion shows solar generating during daylight hours: 7 (7 a.m.) through 18 (6 p.m.). This compares to wind generation, which dips below average in the morning (hours 4 through 12) and hits its nadir in hour 7. Wind generation peaks in hour 20.
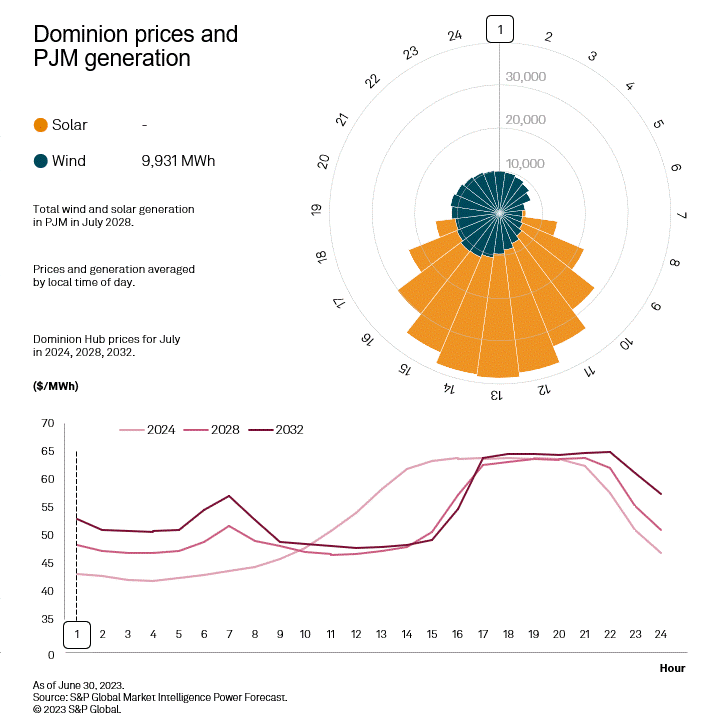
The 2024 zonal price shape for an average day in July differs markedly from the 2028 and 2032 curves. In 2024, prices bottom in hours 2-5 and crest in hours 15-20. The curves illustrate the effects of solar generation between 2024 and 2028, with lower prices in hours 10-17 when solar generation is at its zenith. Prices in 2032 and 2028 track closely to one another, with notable exceptions in hours 23, 24, and 1-7 when the sun is not shining and wind generation falls. The decreasing solar capture ratio in Dominion reflects the change in the zonal price shape.
Wind and solar resources have marginal costs of zero and less than zero if a production tax credit is used for the project. As wind and solar increase their generation in a zone, the price may fall in the hours those resources generate, creating lower capture ratios. This is the case in Dominion. Actual 2022 capture price data from Platts shows a solar capture ratio of 1.07 and a wind capture price ratio of 1.02, meaning both were above the average price. In 2024, the capture ratio is close to 1 for both wind and solar. The ratio decreases as wind and solar penetration increases. The solar capture ratio is 0.91 in 2028 and 0.86 in 2032. The wind capture ratio is 0.96 in 2028 and 0.93 in 2032. With the renewable portfolio standard of 100% by 2045 and 2050, the 0.86 and 0.93 capture ratios in 2032 are higher than we may likely see as the renewable targets approach. These ratios can be used, along with a long-term forecast of prices, to compute the returns of wind and solar projects in the region.
Nonnegligible assumptions underpin the forecast capture ratios. For example, solar and wind generation are modeled on a fixed profile that does not vary year to year or across resources in a region, whereas actual generation shows much more diversity. Forecast capture ratios also reflect average weather and load conditions, whereas actual weather variations drive both load and available generation from wind and solar.
For wholesale prices and supply and demand projections, see the S&P Global Market Intelligence Power Forecast.
Regulatory Research Associates is a group within S&P Global Commodity Insights.
Platts 2022 capture price data is an offering of S&P Global Commodity Insights. S&P Global Commodity Insights is a division of S&P Global Inc.
Steve Piper, Tony Lenoir and Chris Allen Villanueva contributed to this article.
This article was published by S&P Global Market Intelligence and not by S&P Global Ratings, which is a separately managed division of S&P Global.