
China’s international trade activity continued its slow but steady decline in November, with a 0.5% year over year decline in combined imports and exports, Panjiva’s analysis of official data shows. That marks the seventh straight decline, though that was a slower rate since the downturn started and was well below the 4.7% rate seen in the three months to October 31.
On the negative side the rate of decline in exports accelerated to 1.1% in November from 0.8% in October and excluding the volatile shipping sector the decline was 2.0%.
The good news for the rest of the world though is that imports improved by 0.3% compared to a 6.2% slide in October. That indicates Chinese government stimulus is working – imports excluding those from the U.S. improved by 0.1% from a 7.5% slide in the prior three months.
IMPORTS INCH UP, EXPORTS STILL IN DECLINE
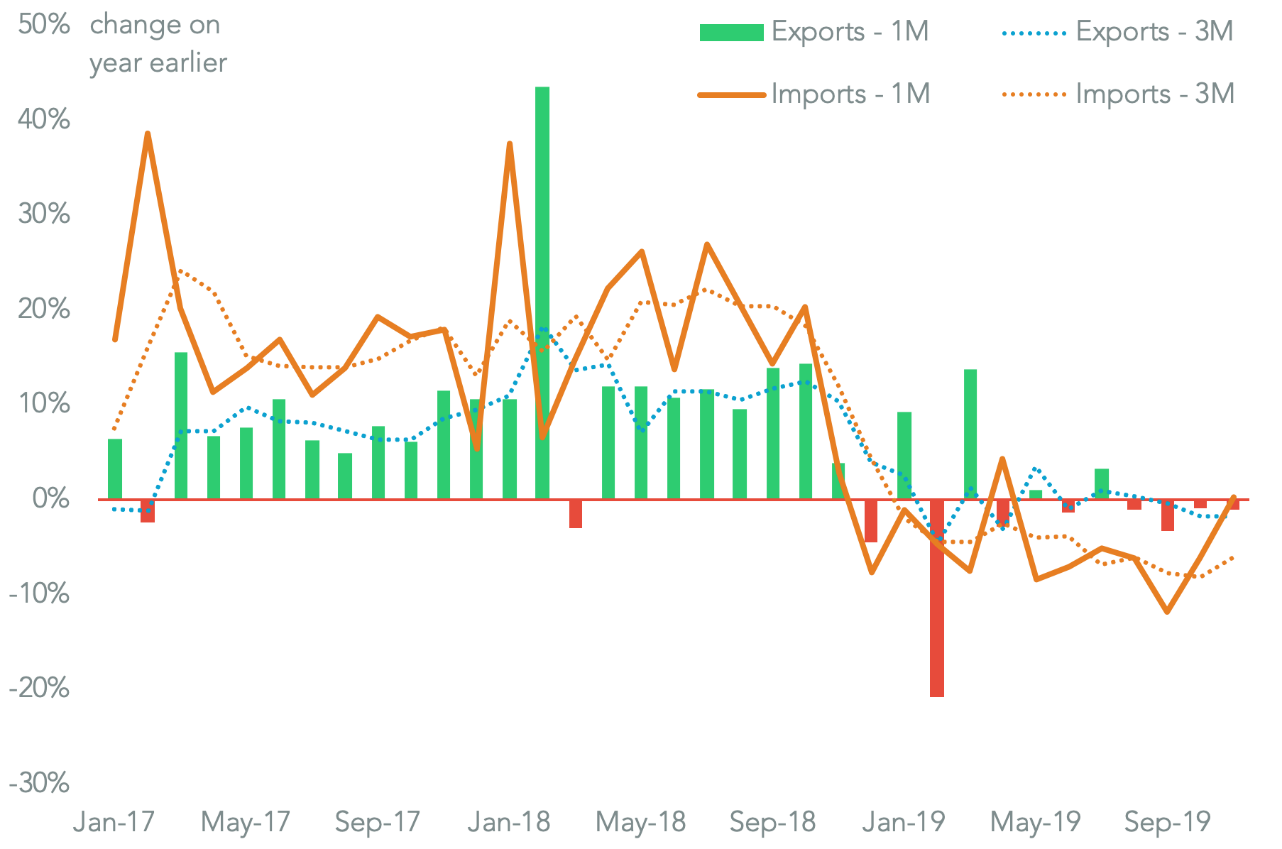
Chart segments change in Chinese merchandise trade by direction and time-frame. Calculations based on China General Customs Administration data. Source: Panjiva
Importantly, trade with the U.S. slumped by 18.2% year over year in November. Unsurprisingly exports to the U.S. slumped 23.0% lower, providing an acceleration from 18.1% in the prior three months. The extension of tariffs to cover 68.1% of exports in September from 48.0% a year earlier combined with the higher baseline a year earlier from a pre-tariff increase rush – list 3 tariffs were originally going to increase from January 1, 2019 but were delayed until May – explain the acceleration.
The accelerating decline may provide another signal to the administration of President Donald Trump that tariffs are working, increasing the likelihood they will be retained and cutting the potential for a phase 1 trade deal, as discussed in Panjiva’s research of December 6.
There was also a 2.9% rise in imports from U.S., marking the first year over year improvement since tariffs were implemented in August 2018. That may have been driven by accelerated “goodwill” agricultural purchases and accelerated imports of electronic components.
CHINA’S NET EXPORTS TO THE U.S. IN RAPID DECLINE
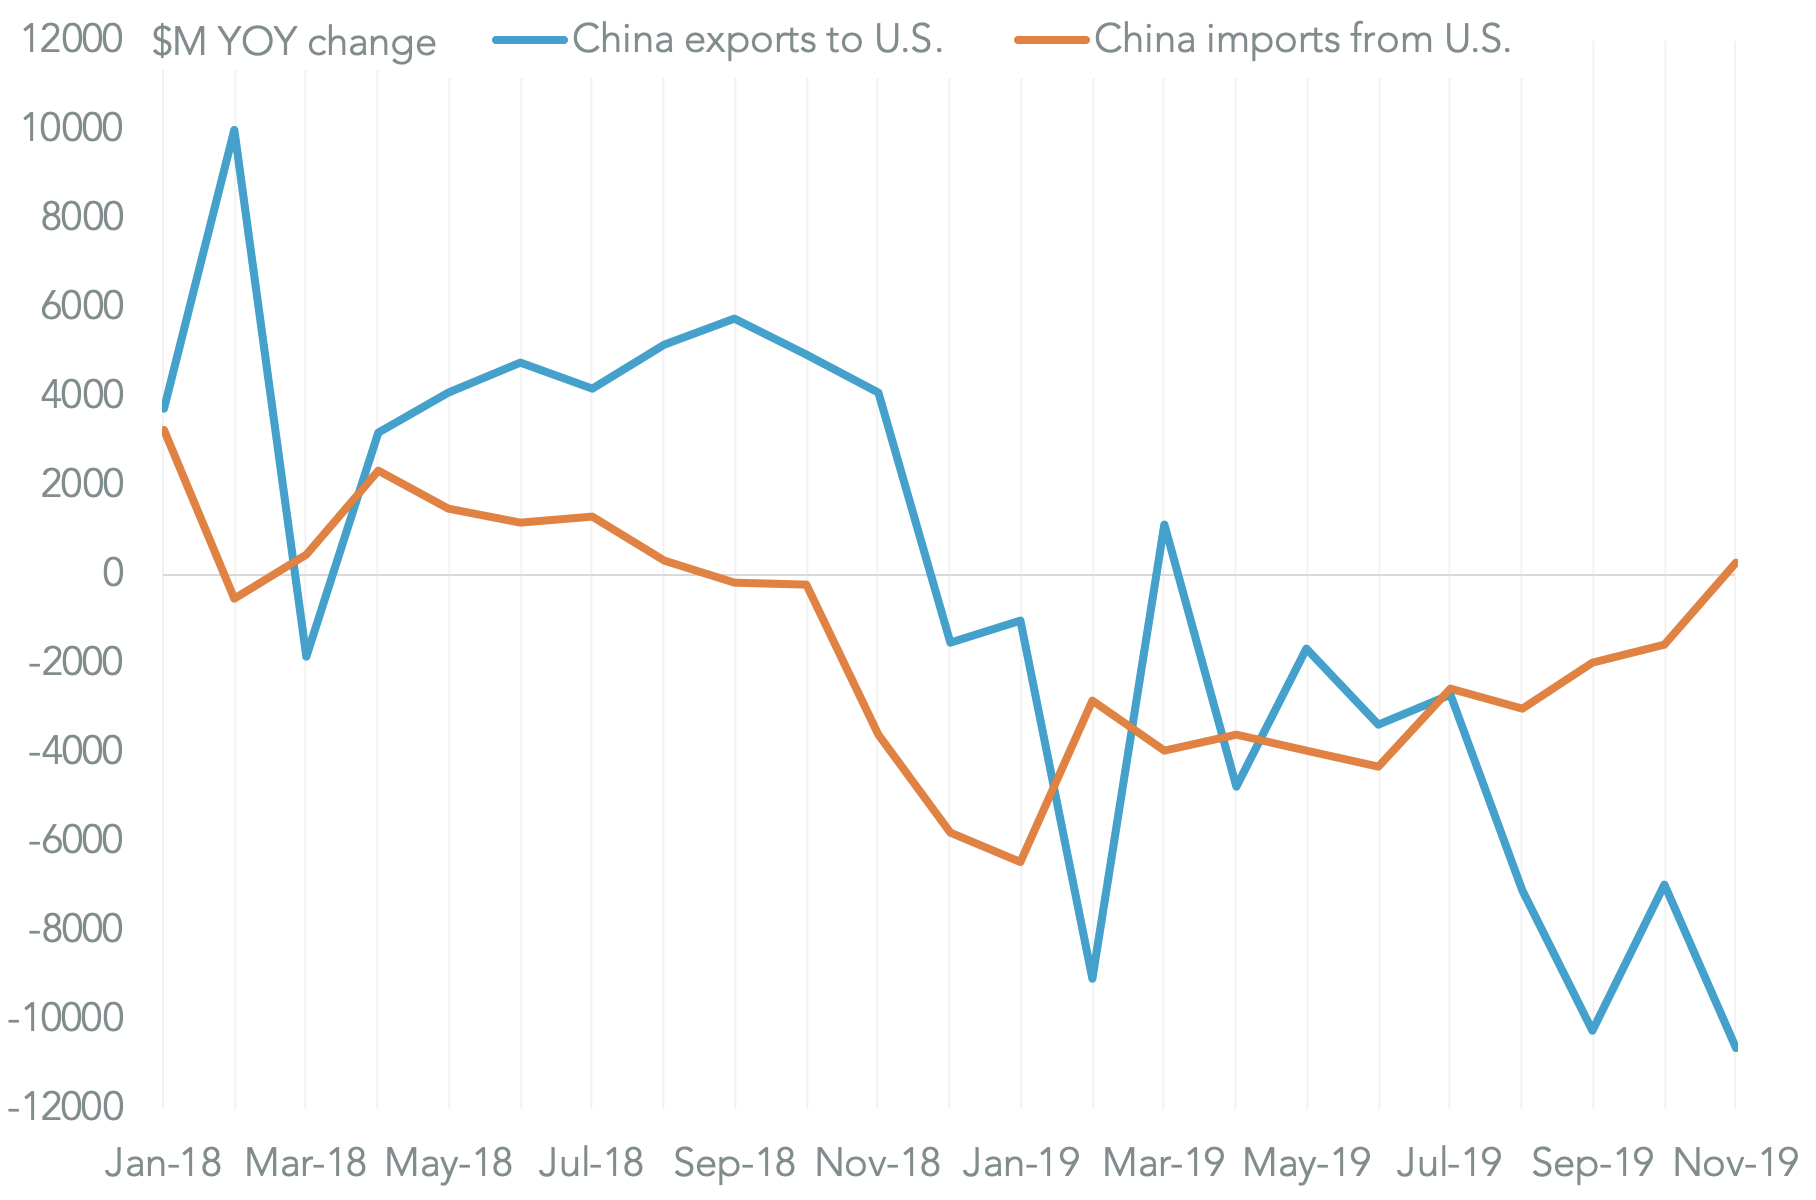
Chart segments year-over-year change in dollar value of trade with the U.S. by direction. Calculations based on China General Customs Administration data. Source: Panjiva
Those two phenomena can be seen in total Chinese imports at the product level from all countries. Total Chinese imports of soybeans jumped 40.9% year over year, marking the first increase since April. While the swine flu epidemic reportedly remains rife, the lower baseline combined with potential goodwill purchases from the U.S. may explain the change.
Similarly there was a 17.5% jump in imports of electronic circuits from all countries. That was the first rise since October 2018. In the prior months total imports fell by 7.2%, but included a 12.4% rise in imports from the U.S., Panjiva data shows. Chinese manufacturers may be stockpiling ahead of a new U.S. approach to controlling technology exports which has been proposed by the U.S. Commerce Department.
CHINA’S CIRCUIT IMPORTS POWER UP
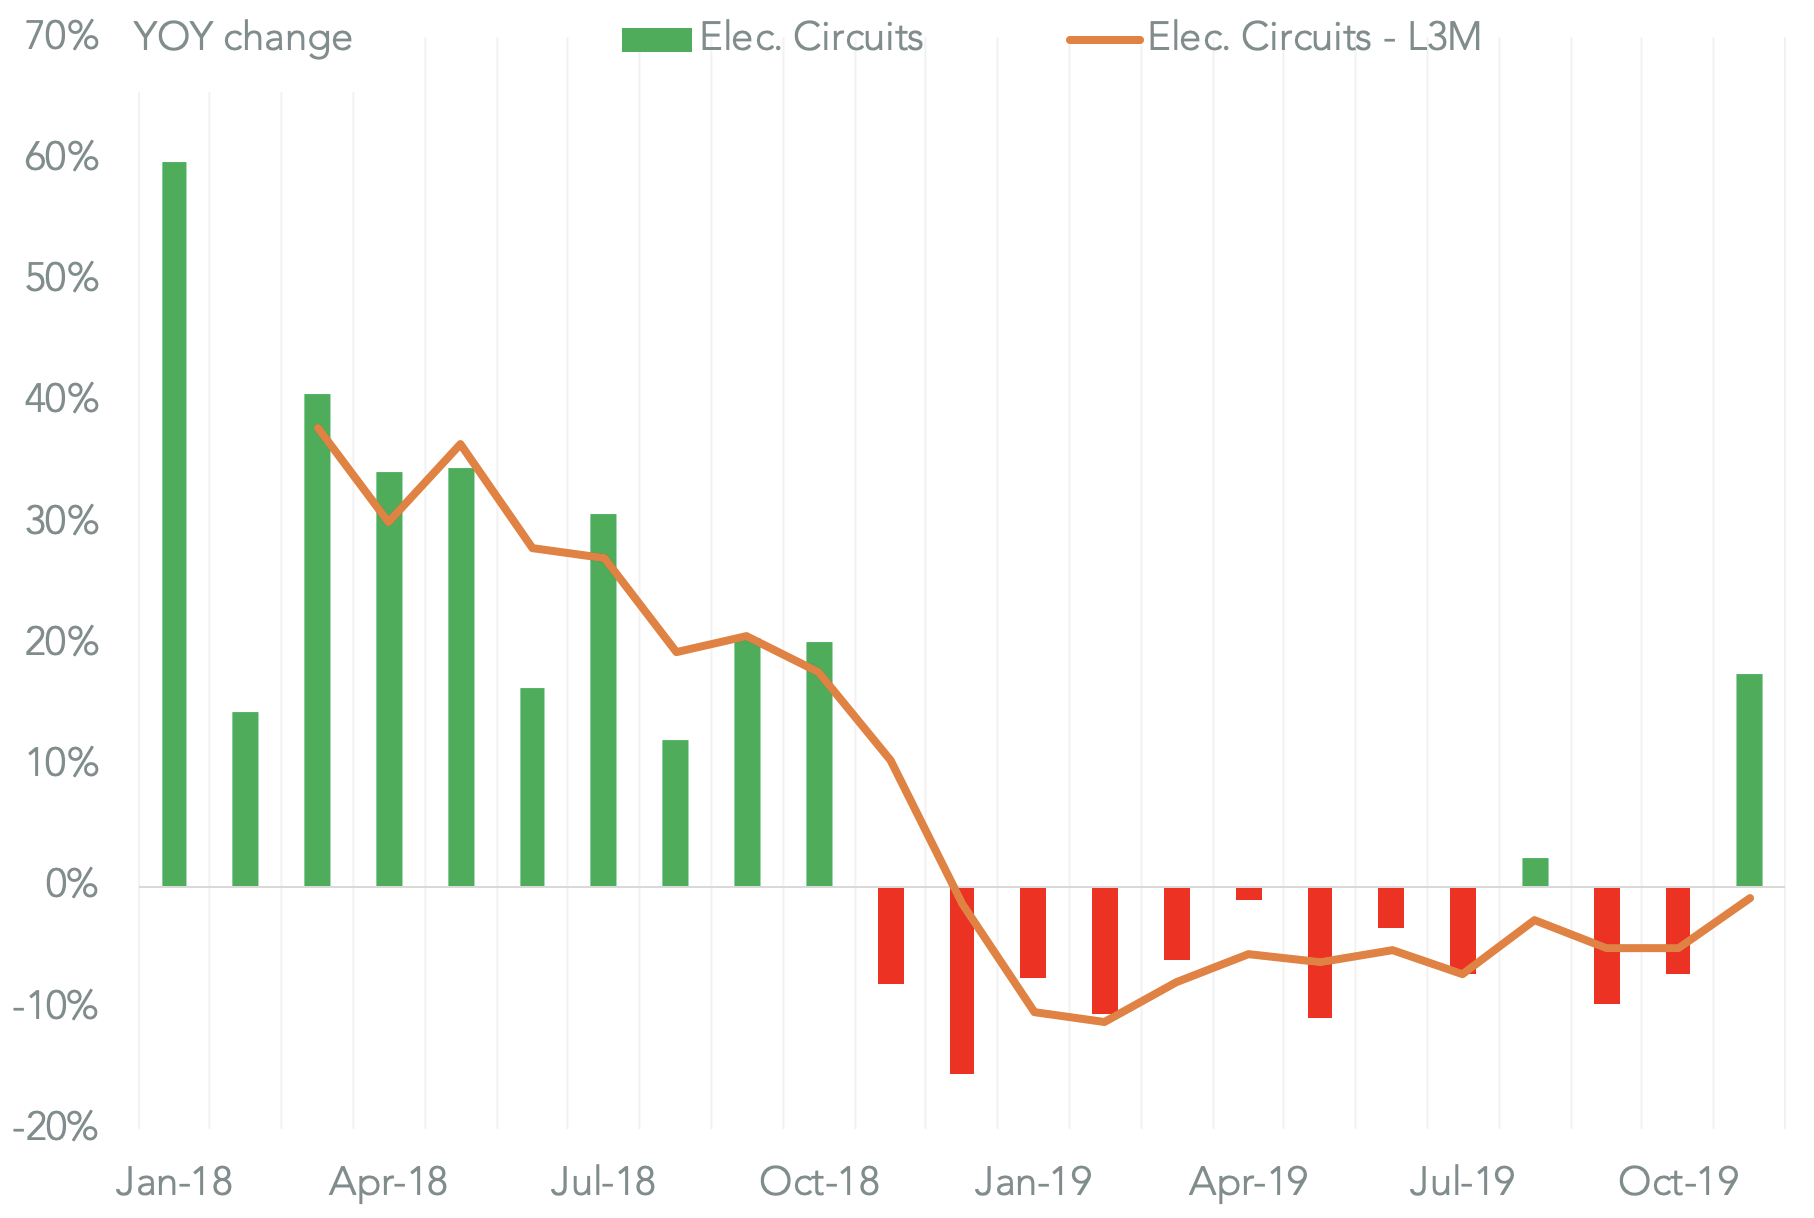
Chart shows change in Chinese exports of electronic circuits on a monthly and trailing three month average basis. Calculations based on China General Customs Administration data. Source: Panjiva