
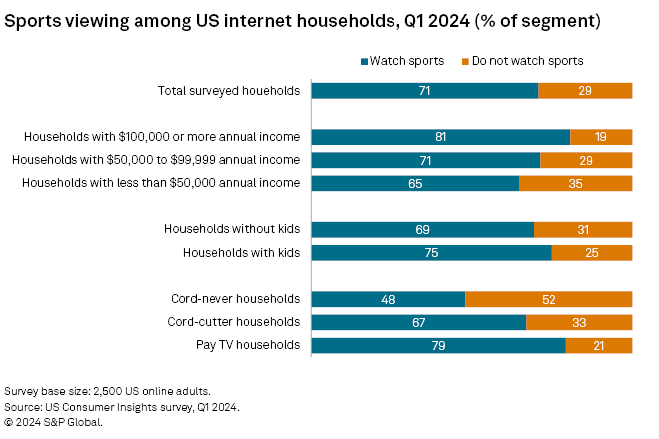
eventy-one percent of US internet households surveyed in the first quarter of 2024 reported sports being watched in the home, highlighting the important role of sports programming in the US media landscape. Access to live sports is not only encouraging some households to keep their traditional pay TV service, streaming services including Netflix Inc., Amazon.com Inc.'s Prime Video, Warner Bros. Discovery Inc.'s Max, Paramount Global's Paramount+ and Comcast Corp.'s Peacock are investing in live sports and sports entertainment programming.

➤ Sports programming is viewed by a sizable majority of US internet households across traditional pay TV homes and by households that have cut the pay TV cord.
➤ The likelihood of a US online home viewing sports rises as total annual household income increases, and the presence of children in the home also impacts the likelihood of viewing sports.
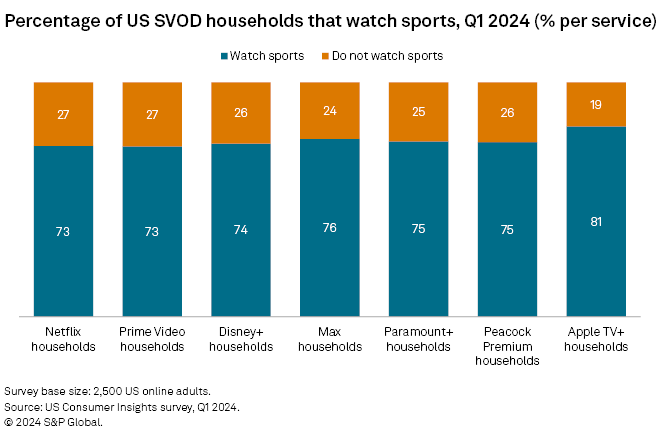
➤ Subscription video-on-demand households are also very likely to watch sports, paced by homes that use services such as Apple TV+ and Max.

Results from S&P Global Market Intelligence Kagan's Consumer Insights online survey of 2,500 US adults conducted in the first quarter of 2024 show a strong affinity for sports viewing across most household types. Higher-income homes and pay TV homes were the most likely to report viewing sports at about 80%, with the presence of children in the home also boosting the likelihood of watching sports.
Cord-never homes (households that have never signed up for a pay TV service) did lag other household types analyzed here with just 48% viewing sports, although it should be noted that roughly half of cord-never homes viewing sports is still a significant audience.
Shifting the sports viewing lens to US households that watch sports and also reported using specific SVOD services, little difference separated services. While SVOD households were overall more likely than total respondents to say they view sports, roughly the same percentage of individual service households — 73% to 76% — said they watch sports. Apple TV+ households were the only outliers with 81% reporting that they also view sports, a trend that continues through the data presented here.
Please note that two independent questions were asked as to whether a respondent household used an SVOD service and whether that household views sports. For example, percentages shown do not reflect the share of Netflix subscriber households watching sports specifically on Netflix; results show the percentage of Netflix households that watch sports overall via any channel.
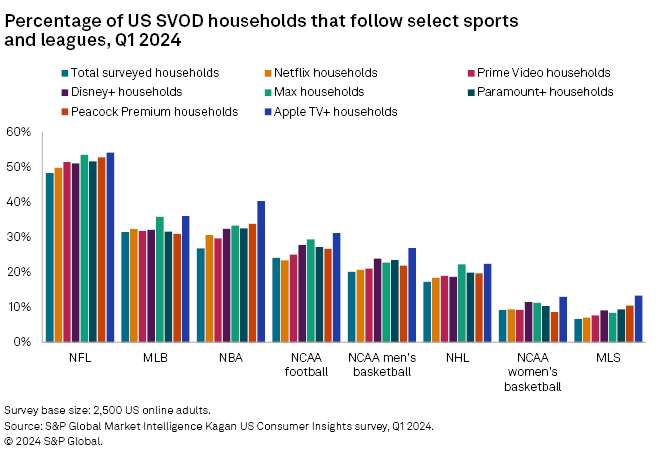
When respondents were asked about specific sports leagues and events they typically follow, Apple TV+ homes once again rose to the top across all major US leagues and events. While Apple has invested in sports including baseball and soccer, the affinity of Apple TV+ users for sports may be less driven by unique programming or content strategy than by a tendency of households using Apple products and services to skew overall toward characteristics that drive sports viewing such as comparatively high household income, a greater likelihood of children in the home, and an increased likelihood of subscribing to pay TV and to numerous SVOD services.
Outside of Apple TV+ households, homes with Max, Peacock Premium and Paramount+ were typically the next most likely to follow major US sports. Peacock and Paramount+ offer the most sports programming overall among major US SVOD entertainment services (excluding sports-focused services like ESPN+) and the B/R Live add-on option for Max users unlocks access to most Warner Bros. Discovery sports programming in the US.
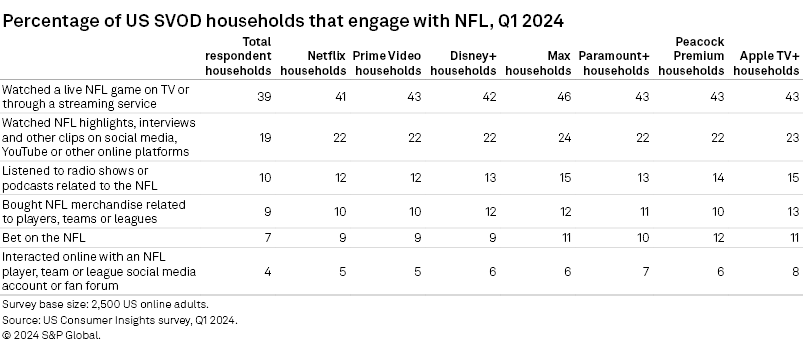
Respondents who said they follow individual leagues and events were asked a follow-up question for specific activities related to that sport to gauge engagement past simply viewing a game. Using data for NFL engagement as an example, 41% of total Netflix homes said they typically watch live NFL games, either on linear TV or through a streaming service, while 22% watched NFL highlights on YouTube social media, 10% bought NFL merchandise and 9% bet on NFL games.
NFL engagement was fairly consistent across SVOD services, although homes using Apple TV+, Max and Peacock were slightly more likely to engage in behaviors such as listening to radio shows and podcasts related to the NFL, betting on the NFL, and interacting with NFL team and player accounts on social media.
The Kagan US Consumer Insights first-quarter 2024 survey was conducted during March 2024 and consisted of 2,500 internet adults. The survey has a margin of error of +/- 1.9 ppts at the 95% confidence level.
Consumer Insights is a regular feature from S&P Global Market Intelligence Kagan.
This article was published by S&P Global Market Intelligence and not by S&P Global Ratings, which is a separately managed division of S&P Global.