
With an operating generation fleet of nearly 14 GW and a country-leading 90-GW pipeline, Texas is at the forefront of US grid-scale photovoltaic energy, thanks in part to favorable economics. Projected solar financials for the Lone Star state and Electric Reliability Council of Texas Inc. (ERCOT), though varying across locations, look bright over the latest S&P Global Market Intelligence Power Forecast, with solid revenues in the Houston zone while finances in the West zone are affected by limited transmission and increasing curtailment.

Healthy projected solar economics underpin Texas' 90-GW photovoltaic pipeline, with net energy revenues exceeding the debt threshold from 2024 through 2033 across the entire state. Profitability is forecast to vary across zones, however.
In the ERCOT Houston zone — which is expected to benefit from the highest power prices within the ERCOT footprint — combined net energy revenues, net capacity revenues and modest renewable energy credit (REC) revenues meet or exceed the anticipated full equity return target. The revenue combination falls short of a full return in ERCOT West, however, with the zone affected by curtailment from intermittent renewable generation and limited transmission.


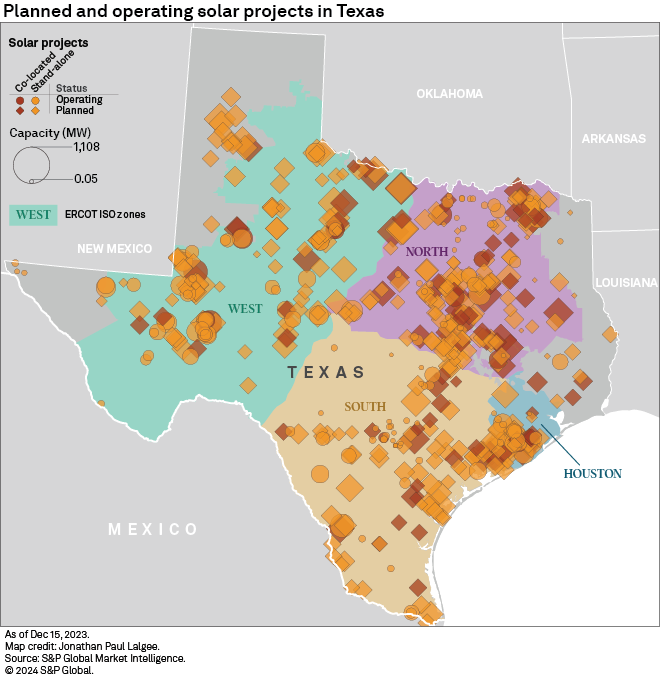
Despite essentially negligible state-level clean energy requirements, Texas has emerged as the leader for renewable energy deployment in the US. Texas already operates 13.9 GW of solar capacity along with 41.4 GW of wind. Looking at the state's pipeline, solar dominates, with about 90 GW in planning, compared with 12.9 GW for wind. In 2022, Texas produced 4.3% of its electricity from solar and 21.8% from wind. The share of solar in the generation mix is projected to more than double by 2033, to 10.0%.
The anticipated evolution of solar energy in the state is supported by strong financials. Net energy revenues are forecast to exceed the debt threshold from 2024 to 2033. Solar financial forecasts vary by ERCOT zone, however, with Houston showing the most promising prospects and ERCOT West lagging behind.
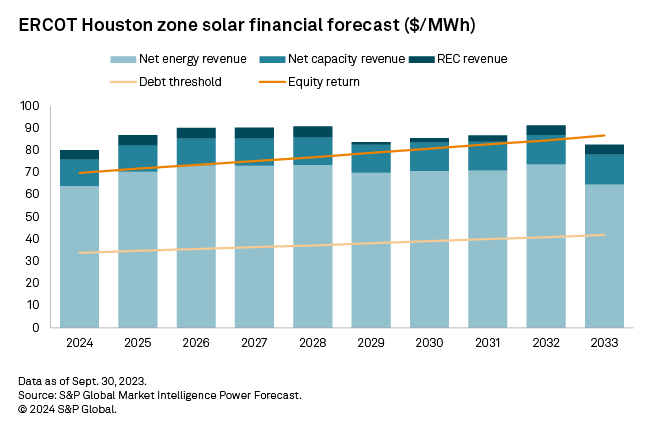
The ERCOT Houston zone has the highest power prices in ERCOT, as it has the most demand and the least generation. This results in high net energy revenue for solar projects, between $64/MWh and $74/MWh. The net energy revenue easily exceeds the debt threshold in all years. The equity threshold is exceeded in 2024–32 when net energy revenue, net capacity revenue and REC revenue are combined. We forecast the zone's strong economics will contribute to further solar development there.
In 2033, we model solar's generation share in the Houston zone to reach 18%. With this increase, we start to see decreasing energy prices in the middle of the day. From 2027 onward, the price received for solar generation in the Houston zone is forecast to come in at less than the zone's average across all forms of power generation.
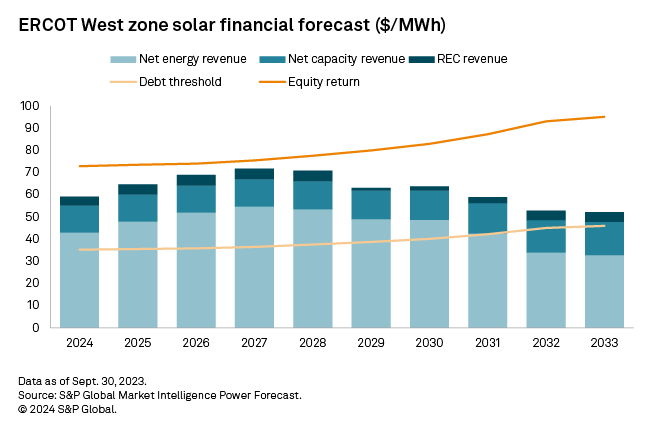
About half of Texas' operational wind fleet is found in the ERCOT West zone, and wind is forecast to supply about 80% of generation there throughout the forecast. This large intermittent renewable generation is sometimes larger than local electricity demand plus transmission capacity and is therefore subject to curtailment. If wind generation is high in hours when solar is also generating, curtailment of solar generation also occurs in this zone.
ERCOT West solar net energy revenues are forecast to fall short of the debt threshold in 2032 and 2033. Combined net energy, net capacity and REC revenues are less than 80% of the equity return in 2029–33, with solar curtailment reducing returns after 2029.
ERCOT does not currently have a capacity market. "Capacity revenue" mentioned in this article represents estimated scarcity payments via the operating reserve demand curve (ORDC).
Visualization by Joseph Reyes.
Cartography by Jonathan Paul Lalgee.
For wholesale prices and supply and demand projections, see the S&P Global Market Intelligence Power Forecast.
Regulatory Research Associates is a group within S&P Global Commodity Insights.
S&P Global Commodity Insights produces content for distribution on S&P Capital IQ Pro.
Tony Lenoir contributed to this article.
This article was published by S&P Global Market Intelligence and not by S&P Global Ratings, which is a separately managed division of S&P Global.