
Markedly higher-than-normal wind speeds swept the U.S. heartland in the fourth quarter of 2022, with weighted average deviations in the mid- to high single digits, possibly boosting wind yields across states that have placed big bets on the renewable source of energy.
![]()
Nearly half of the U.S. states, operating more than 200 MW of wind energy, experienced wind speeds below normal in the fourth quarter of 2022. Across areas in positive territory, however, states within the Midcontinent ISO and the Southwest Power Pool, where wind weighs heavily in the generation balance, experienced particularly dramatic jumps.
This likely benefited portfolio owners with large stakes in the Midwest, including Allete Inc., Alliant Energy Corp., Berkshire Hathaway Inc. and Xcel Energy Inc.
![]()
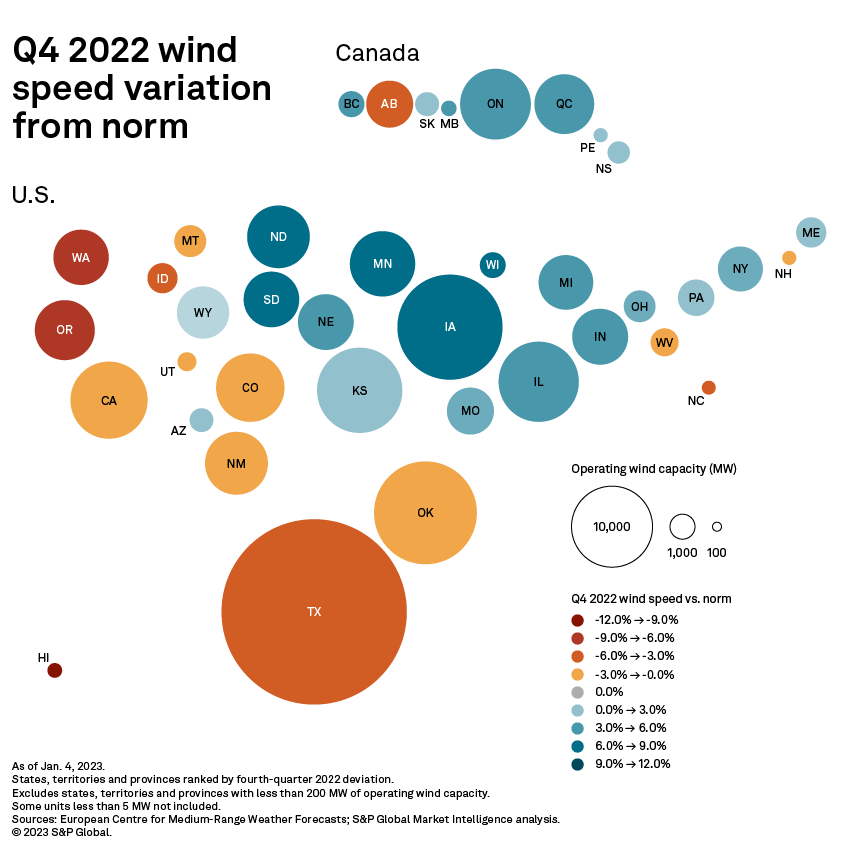
On average, winds blew 0.9% faster than the norm across the U.S. and Canadian wind holdings, which expanded 2.2% sequentially during the quarter and grew 6.2% overall in 2022. Overall, speeds clocked above normal in 17 U.S. states and seven Canadian provinces, with projects west and southwest of the Great Lakes experiencing particularly dramatic deviations. The average wind speed of wind portfolio leader Texas — which operates a quarter of the wind capacity across the U.S. and Canada and has 77 GW of additional wind in planning — retreated 3% from the norm, however.
The Dakotas and Minnesota top the positive deviation charts, with analyzed wind speeds up more than 8% from their 20-year averages. Fellow midwestern states of Wisconsin, Iowa and Illinois are not too far behind, with robust mid-single-digit deviations. Hawaii and the Pacific Northwest bring up the rear, with Hawaii logging a double-digit pullback, and Oregon and Washington experiencing drops of 6.7% and 8.2% from the norm, respectively. Further south along the West Coast, California was also down, but comparatively more palatable at 2.3%.
With approximately 12 GW in combined wind capacity, Minnesota and the Dakotas account for less than 9% of the operating U.S. total, but wind plays a comparatively critical role in the local energy mix, as it does in several other states across relatively windy MISO and SPP. Wind capacity accounts for 33% of Minnesota's generation fleet. The metric hovers around 45% in North and South Dakota. Farther to the south, Iowa boasts the second-largest U.S. wind portfolio, with wind making up more than 52% of Iowa's generation assets.
The fourth-quarter speed surge across the U.S. heartland most likely benefited wind capacity owners with a strong concentration of their wind operations in the region. Deviations from wind speed potential may impact company profits. NextEra Energy Inc., for example, reports that a 1% change in their wind production index causes a 1-cent change in EPS.
Thanks to a nearly 53% wind generation fleet exposure to Minnesota, North Dakota and South Dakota, Xcel Energy Inc. logged the largest portfolio average wind speed jump among the top 10 owners of operating U.S. and Canadian wind capacity — up 4% from its 20-year average in the fourth quarter. Sixteen of the 19 wind projects owned by Xcel had above-average speeds during the period, with nine of those experiencing variations above 8%. That said, the company's largest two wind projects — 600-MW Rush Creek Wind Farm based in Colorado and 522-MW Sagamore Wind Project based in New Mexico — were among the three in negative territory, pressuring Xcel's portfolio average speed.
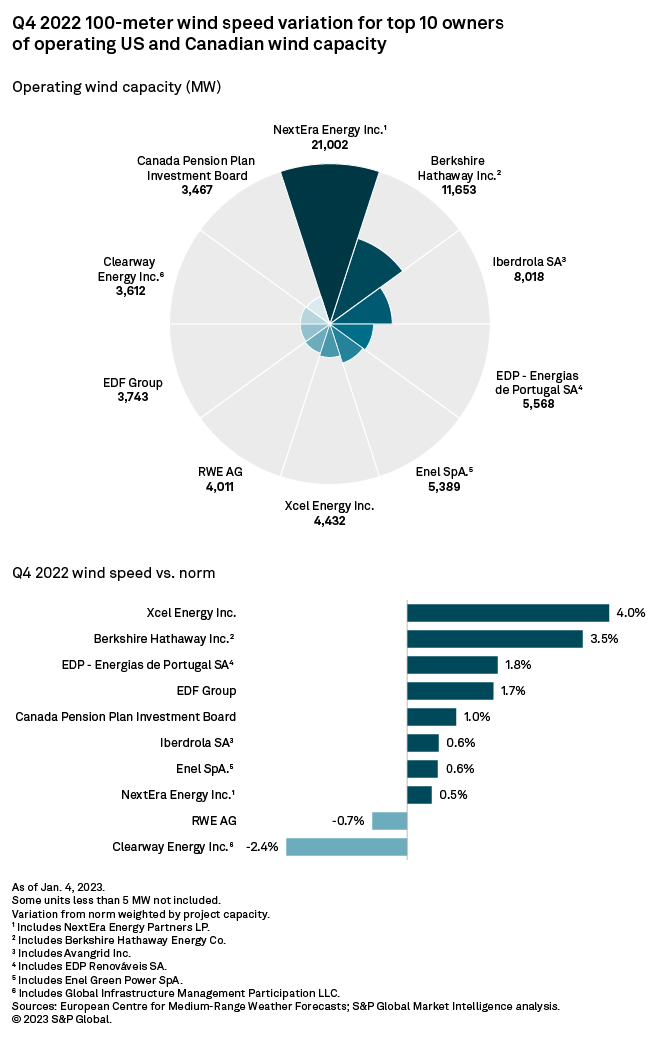
Across the midsize operator space, or companies holding between 1,630 MW and 3,100 MW of wind capacity, portfolio-wide wind speed deviations from the norm ranged from a negative 1.7% for Duke Energy Corp. to 6.9% at Alliant Energy Corp. Nearly 77% of Alliant's wind projects are based in Iowa; another 11% are based in Minnesota. Alliant's Minnesota-based 201.3-MW Bent Tree Wind farm, powered by winds that have averaged 7.6 meters per second in the last 20 years, benefitted from a 9% leap above the norm. In Iowa, the company's 299.3-MW Upland Prairie Wind Farm (New Wind) and 199.3-MW Golden Plains Wind Project, also powered by 20-year average wind speeds around 7.6 meters per second, logged deviations of 8.8% and 8.2%, respectively.
NextEra Energy is the largest owner of wind capacity in the Dakotas, holding 1,650 MW in North Dakota and 591 MW in South Dakota. This, however, accounts for less than 11% of the company's overall wind portfolio — the largest across the U.S. and Canada — at more than 21,000 MW. Nearly half of the NextEra wind portfolio is based in Texas, Oklahoma and Colorado, with Texas alone accounting for a quarter of the total. All three states exhibited declines in wind speeds in the fourth quarter, weighing on NextEra's portfolio weighted average.
NextEra's Pacific Northwest wind projects did not help, with the 25-MW Vansycle I Wind project, the 98.9-MW Vansycle II Wind Energy Center and the 122.8-MW Stateline Energy Center (OR) in Oregon and Washington experiencing negative speed variations greater than 10%. Overall, NextEra's portfolio average wind speed tracked relatively closely to the 20-year average in the fourth quarter, up a slight 0.5%. This compares to a 0.6% downtick in the year-ago period, despite dramatic negative deviations in the company's largest markets, including a 9.3% decline in Texas. NextEra's steady companywide wind averages arguably illustrate a well-diversified portfolio.
The wind speed 100 meters above the ground is measured from the fifth-generation European Centre for Medium-Range Weather Forecasts reanalysis. The data is available at quarter-degree latitudes and longitudes — a spacing of slightly over 27.5 kilometers. This analysis compares fourth-quarter wind speed values with the 20-year wind speed average for the corresponding period.
For wholesale prices and supply and demand projections, see the S&P Global Market Intelligence Power Forecast.
Regulatory Research Associates is a group within S&P Global Commodity Insights.
S&P Global Commodity Insights produces content for distribution on S&P Capital IQ Pro.
Kristin Larson, Monesa Carpon and Joseph Reyes contributed to this article.
This article was published by S&P Global Market Intelligence and not by S&P Global Ratings, which is a separately managed division of S&P Global.