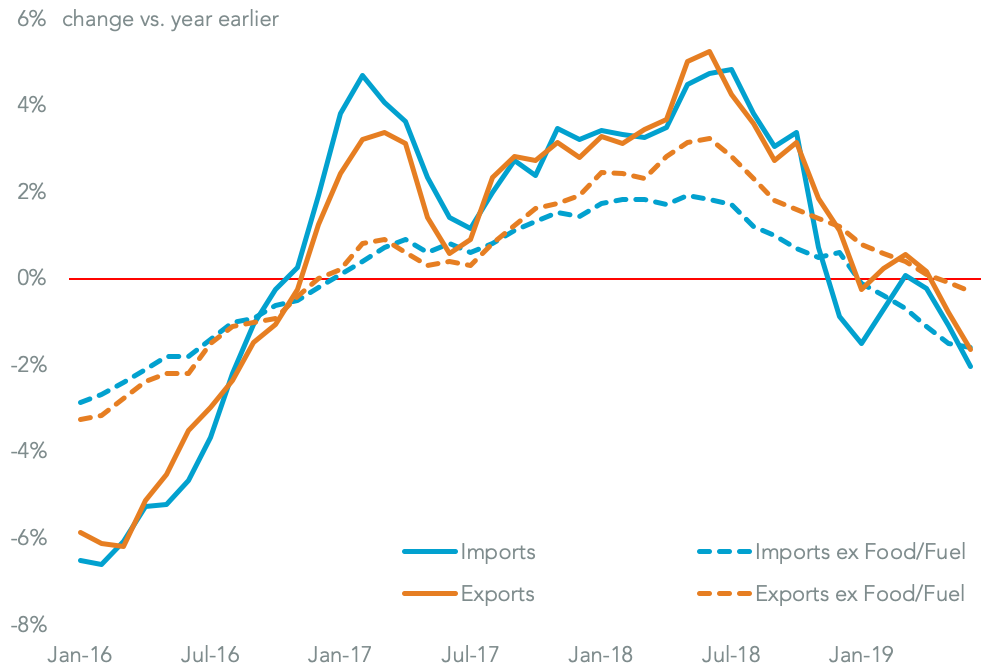
U.S. trade price deflation continued to accelerate in June, Panjiva’s analysis of official data shows, with import prices having fallen by 2.03% year per year and exports down by 1.64%. Excluding the volatile food and fuels elements imports fell 1.59% and exports by 0.29%. The import price deflation was the fastest since Jun. 2016’s 1.8%.
LITTLE SIGN OF DEFLATION REVERSING

Chart segments U.S. trade price inflation by direction and product inclusion. Calculations include Bureau of Labor Statistics figures. Source: Panjiva
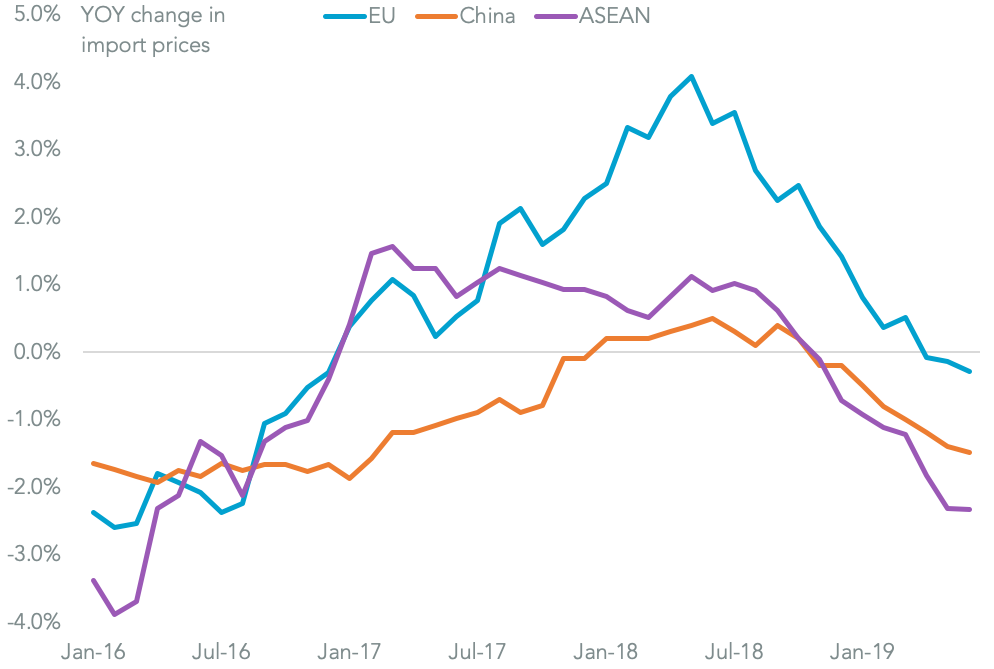
The price deflation has been broad-based with six of the eight regionscovered seeing lower year-over-year prices. Among the major manufacturing supply centers ASEAN prices fell the quickest with a 2.3% decline, while prices for imports from China fell 1.5% and those from the EU by 0.3%.
EU JOINS ASIA IN U.S. IMPORT PRICE DEFLATION

Chart segments U.S. import price inflation by origin. Calculations include Bureau of Labor Statistics figures. Source: Panjiva
Imports from China have seen an acceleration in deflation since November, suggesting that one driver has been a reduction in prices to offset an increase in tariffs. The increase in duties on “list three” products to 25% from 10% from May – outlined in Panjiva’s research of Jul. 16 – has likely driven the extended deflation.
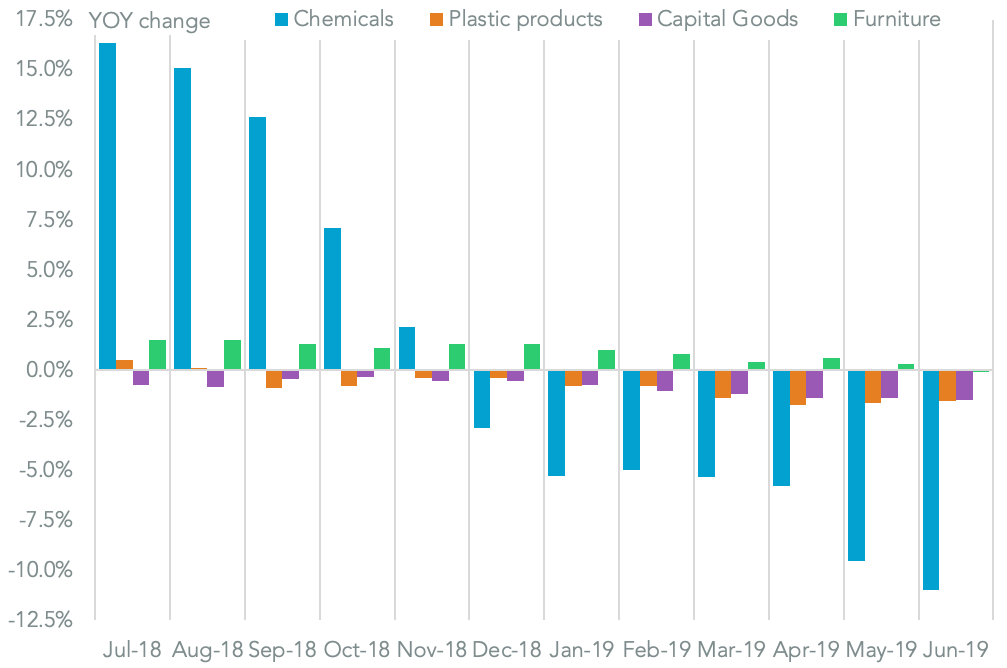
Evidence for the impact on tariffs on export pricing from China can be seen most starkly in: chemicals where prices dropped for a seventh straight month at an 11.0% year over year rate of deflation; capital goods manufacturing where priced deflation increased for a sixth straight month by 1.5%; furniture where deflation of 0.1% followed 18 straight months of increases.
CHINA’S CHEMICAL EXPORTERS REACT TO TARIFFS WITH LOWER PRICES

Chart segments U.S. import price inflation from China by product. Calculations include Bureau of Labor Statistics figures. Source: Panjiva


