
Download The Full Report
Click HereSell-side analyst coverage data provides a new and rich source of establishing connections between firms, as analysts (given their industry expertise) are likely to cover fundamentally related firms. This report uses sell-side analysts’ coverage data to build a connected-firm network (CFN) - a portfolio of companies that are covered by analyst(s) that follow a focal firm. This network has three broad applications: measuring the “strength” of economic relationships between companies; forecasting fundamentals of companies in the network; and as a stock selection signal. Key insights include:
• Connected-firm networks quantify the strength of relationships between companies in the network (Figure 1), unlike sector relationships which are binary.
• The alpha signal constructed from the network is effective across most developed markets, with long-short returns ranging from 4.08% (Europe ex-UK) to 7.78% (US). Performance is also stronger within a universe of firms with the most complex networks (9.69%), vs. 6.02% for a universe of stocks with simple networks.
• Models used to forecast EPS estimate revisions can be improved by incorporating the prior month’s estimate revisions for all the stocks in the company’s connected-firm network.
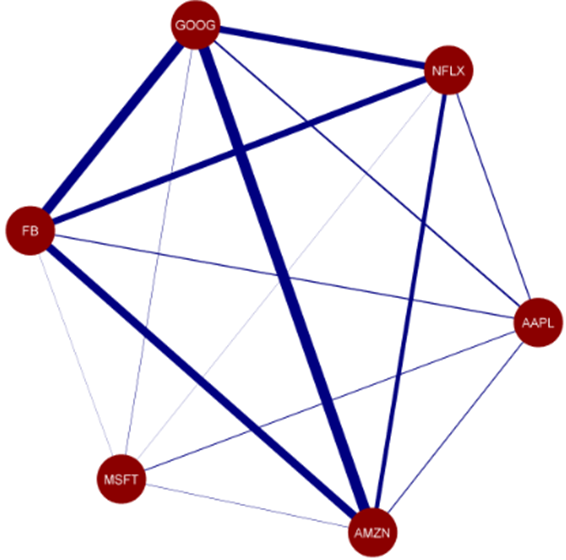
Figure 1 describes the process of building a network using analyst coverage data for six stocks, collectively named FAANGM - Facebook (FB), Apple (AAPL), Amazon (AMZN), Netflix (NFLX), Alphabet (GOOG) and Microsoft (MSFT).
Figure 1: Analyst-Network for FAANGM Stocks as of 12/31/2019
Width of Edges Signify the Number of Analysts that Co-Cover Two Stocks
Source: S&P Global Market Intelligence Quantamental Research. Data as of 02/28/2020.