
Investors’ inability to quickly update asset prices of connected companies with new value-relevant information creates an investment opportunity. Ali and Hirshleifer (2019) argue that the strongest economic linkages between firms are best established using sell-side analyst coverage, as analysts are likely to co-cover firms that provide similar products or services.
View our source code > (Sign Into the S&P Global Marketplace)
Intel’s (NASDAQ: INTC) share price jumped 9.3% on Friday, Oct 27 2023, after the company reported strong earnings. Cadence Design Systems (NASDAQ:CDNS), which announced earlier in the week, was flat. Over the next 2 weeks (Oct 30 – Nov 14), CDNS would outperform INTC by 544 bps, as investors connected the dots between the two. INTC and CNDS do not share a GICS industry, however the two firms share something potentially more meaningful: sell-side analysts.
Figure 1: Intel Corporation’s Connected Company Returns Post Announcement to November 14th, 2023, Global Universe (ex-semiconductor subsector)
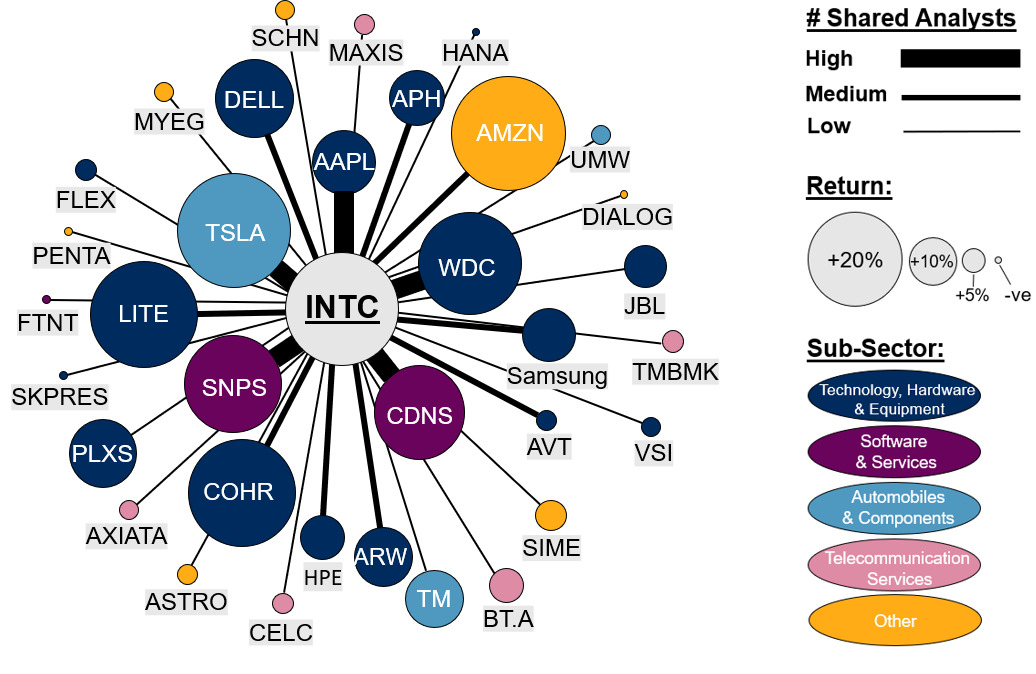
Source: S&P Global Market Intelligence Quantamental Research. Data as of 12/14/2023.
- The co-coverage of two firms by the same analyst implies a commonality or connection; the more shared analysts, the stronger the connection. This work documents a lead-lag return relationship among connected firms.
- Buying (selling) stocks with the best (worst) performing connected companies produced alpha across most developed markets, with long-short returns ranging from 3% in Japan to 8% in the US.
- Investors require more time to process information for companies with complex networks. The long-short return for a universe of small cap stocks with complex networks is 12%, vs. 8.7% for simple networks.
Explore the datasets used to conduct this research
Company Connections: Detailed Estimates
This dataset describes the relationships between companies implied from sell-side analyst coverage by leveraging S&P Capital IQ Detailed Estimates data. These relationships are useful in identifying connections between companies and can be used to improve understanding of peer groups and inform signals based on those connections.
The most comprehensive global estimates based on projections, models, analysis and research. This dataset can be used to evaluate earnings estimates to select stocks and manage investment performance and to track the direction and magnitude of upgrades and downgrades and more.